
Bugs slowing down your project?
Wasted hours hunting for bugs in complex code is a major drain on your team’s productivity. It pushes deadlines further and further away.
These delays not only frustrate your developers but can seriously impact your release schedule, leading to costly production errors and unhappy users.
This challenge is becoming more common. A report from DataIntelo shows the market is growing due to increasing software complexity. This reflects a universal struggle to keep up.
Before diving deeper, you might find my analysis of best customer success software helpful to understand how to keep your users happy.
The right tools can transform this struggle, giving you a way to resolve bugs faster and efficiently.
In this article, I’m going to guide you through the best debugging software for 2025. These tools are designed to streamline your workflow.
You’ll discover solutions that reduce troubleshooting time, improve code quality, and help your team ship reliable applications with confidence.
Let’s dive in.
Quick Summary:
| # | Software | Rating | Best For |
|---|---|---|---|
| 1 | Sentry → | Fast-moving development teams | |
| 2 | Raygun → | Developers & engineering managers | |
| 3 | Lightrun → | Complex distributed systems | |
| 4 | Instabug → | Mobile app engineering teams | |
| 5 | New Relic → | Large engineering teams |
1. Sentry
Struggling to resolve bugs quickly and reliably?
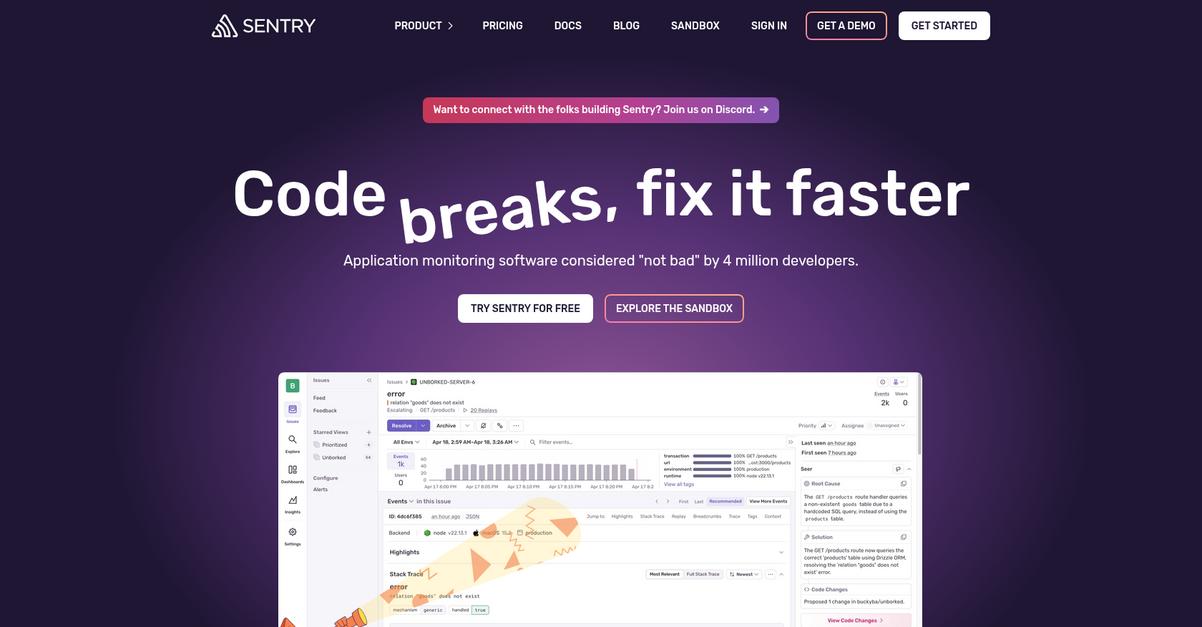
Sentry’s Error Monitoring and Tracing features help you identify, debug, and resolve issues efficiently.
This means you can triage issues based on impacted customers and pinpoint the exact origin of problems, cutting down on wasted hours.
Now, let’s explore how Sentry delivers.
Sentry provides full context, telling you the environment, device, OS, and even the specific commit and line of code that introduced an error. This lets you trace every slow transaction to a poor-performing API call or DB query, empowering your team to proactively fix performance bottlenecks. Additionally, Session Replay lets you see what your users experienced, including dead clicks and rage clicks, offering vital visual context to debug. Plus, Code Coverage insights in your pull requests help shorten review cycles by catching issues early, preventing costly production errors and keeping your development pipeline smooth.
Your team can ship stable products faster.
Before diving deeper, you might find my analysis of real-time insights and boost ROI helpful.
Key features:
- Error Monitoring: Automatically identifies, prioritizes, and helps resolve issues by providing full context like environment, device, OS, and the exact commit and line of code.
- Tracing Capabilities: Visualizes the complete end-to-end data path in distributed systems, enabling you to pinpoint the exact origin of issues and solve slow performance problems quickly.
- Session Replay & Code Coverage: Offers visual debugging by showing user interactions, console output, and network calls, while also integrating code coverage insights directly into pull requests.
Sentry features, pricing, & alternatives →
Verdict: Sentry stands out as a leading best debugging software solution, helping your team fix bugs faster. Its ability to pinpoint issues down to the commit and broken line of code means fixes take minutes instead of hours, keeping your team shipping without delays.
2. Raygun
Tired of manual bug hunting wasting your precious time?
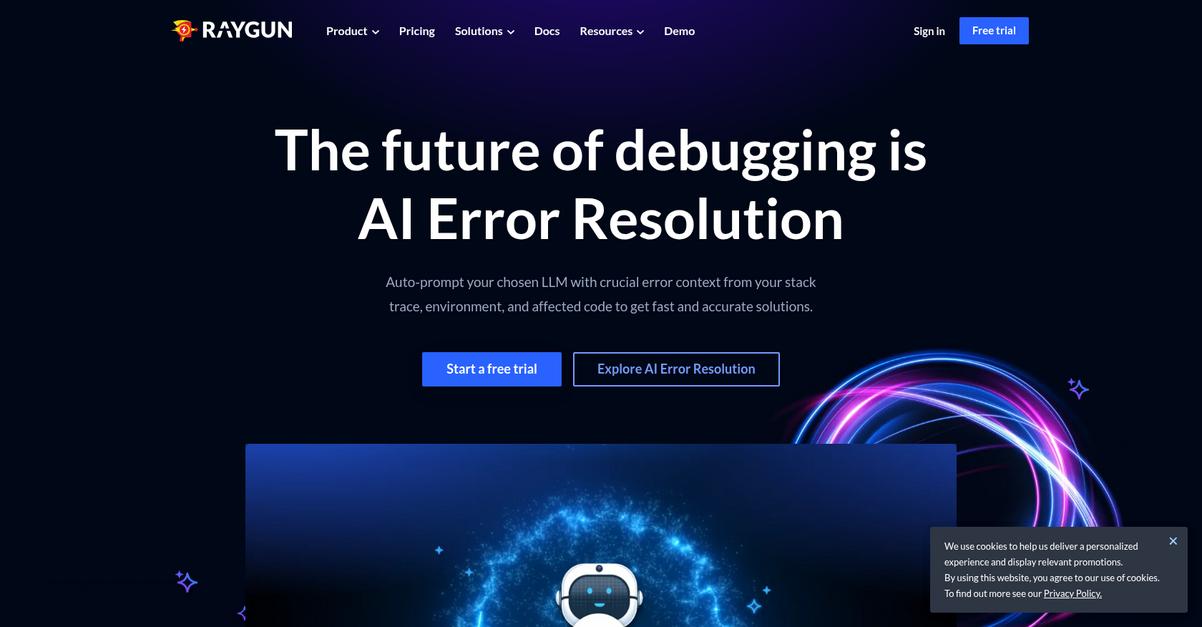
Raygun’s Crash Reporting and AI Error Resolution are designed to help you quickly detect, diagnose, and resolve errors. This means you can reduce errors impacting your checkout process by as much as 90%, accelerating your deployment frequency and increasing revenue. The result is a more efficient workflow for your team.
Here’s how Raygun solves these problems. With Application Performance Monitoring (APM), you gain unrivalled visibility into server-side performance.
This means you can effectively identify bottlenecks and optimize performance for both mobile and web applications. Raygun’s APM provides data-driven monitoring and management of back-end issues, capturing the complete lifecycle of incoming web requests. You can fix performance bottlenecks in minutes, not hours, with root cause analysis and granular diagnostics. Additionally, you get code-level context for every trace, ensuring you master the complexity of your back-end systems. Plus, Real User Monitoring provides granular performance data to improve front-end performance, accelerating conversions.
It all helps you ship stable products faster.
Beyond debugging, efficient business operations also include financial compliance. You might find my guide on VAT software to streamline your submissions helpful.
Key features:
- AI Error Resolution auto-prompts your chosen LLM with crucial error context from your stack trace, environment, and affected code to deliver fast, accurate solutions.
- Crash Reporting allows you to detect, diagnose, and resolve errors with ease, helping you cut down mean time to resolution (MTTR) to as low as four minutes.
- Application Performance Monitoring (APM) provides unrivalled visibility into server-side performance, enabling data-driven monitoring and management of back-end issues.
Raygun features, pricing, & alternatives →
Verdict: Raygun stands out as a strong contender for the best debugging software, particularly for developers and engineering managers who need to resolve bugs faster. Its ability to reduce errors by up to 90% and cut MTTR to just four minutes makes it an essential tool for delivering reliable, high-performing applications.
3. Lightrun
Resolve bugs faster, boost your code.
Wasted hours on manual bug hunting? Lightrun introduces dynamic logs, snapshots (virtual breakpoints), and zero-config metrics directly into your IDE.
This means you can capture context in real-time, pinpoint root causes to the exact line of code, and get fix suggestions instantly, reducing time-to-resolution from hours to minutes. You can now debug without interrupting running applications.
Fix! Verify!
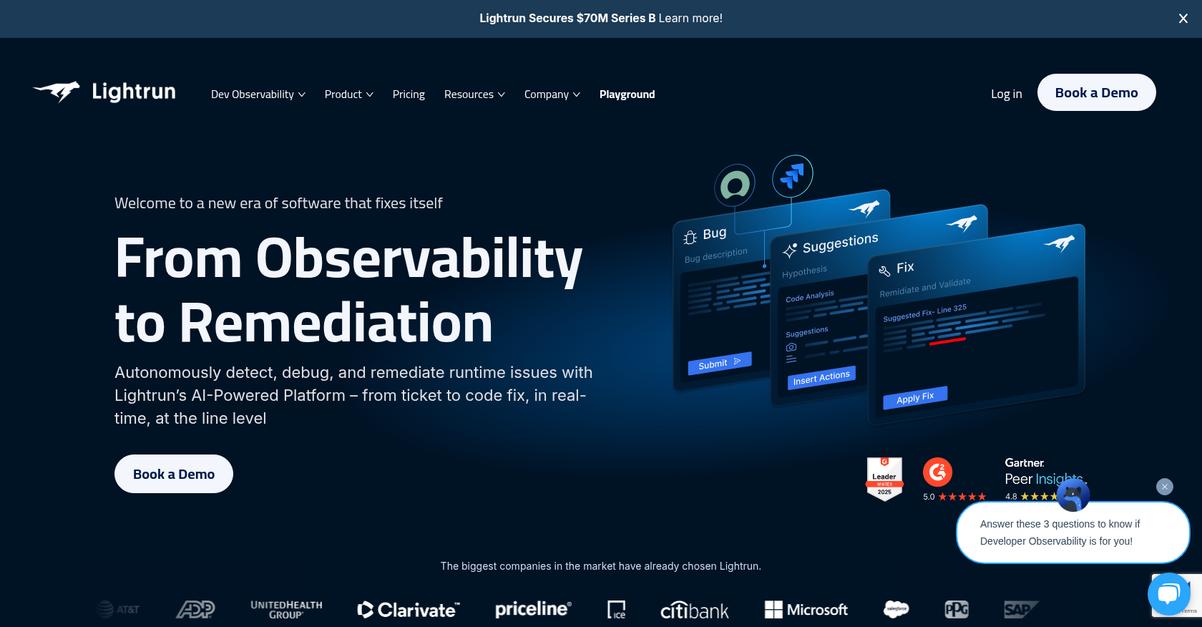
Lightrun’s AI-Powered Platform autonomously detects, debugs, and remediates runtime issues. You can deploy it in various environments like Dev/QA/Staging, CI/CD, and even production.
This enables live debugging in production without stopping execution, and helps you troubleshoot cloud-native, serverless, and CI/CD pipeline applications, improving visibility across replicas and regions. Additionally, its IDE plugin supports popular platforms like IntelliJ IDEA and Visual Studio Code, ensuring a native developer experience. Plus, Lightrun offers dynamic traces and LogOptimizer to improve visibility into application logic and optimize logging costs, ensure minimal overhead and ongoing stability.
The result is faster debugging and improved code quality.
Speaking of production environments, if you also focus on visual aspects, my article on best drawing tools might be useful.
Key features:
- Live Production Debugging: Capture real-time context and resolve issues in production environments without stopping execution or modifying code, ideal for complex, distributed systems.
- AI-Powered Root Cause Analysis: Autonomously pinpoint the exact line of code responsible for issues, offering real-time debugging suggestions to validate findings and accelerate fixes.
- Dynamic Observability Tools: Utilize dynamic logs, zero-config metrics, and snapshots (virtual breakpoints) directly from your IDE to understand code flow and behavior efficiently across diverse environments.
Lightrun features, pricing, & alternatives →
Verdict: Lightrun stands out as a best debugging software solution, accelerating issue resolution and boosting developer productivity. With its ability to reduce MTTR by up to 35% and optimize cloud logging costs by up to 31%, it transforms troubleshooting for complex applications, ensuring your team can ship stable products faster and focus on innovation.
4. Instabug
Struggling with elusive bugs and missed release deadlines?
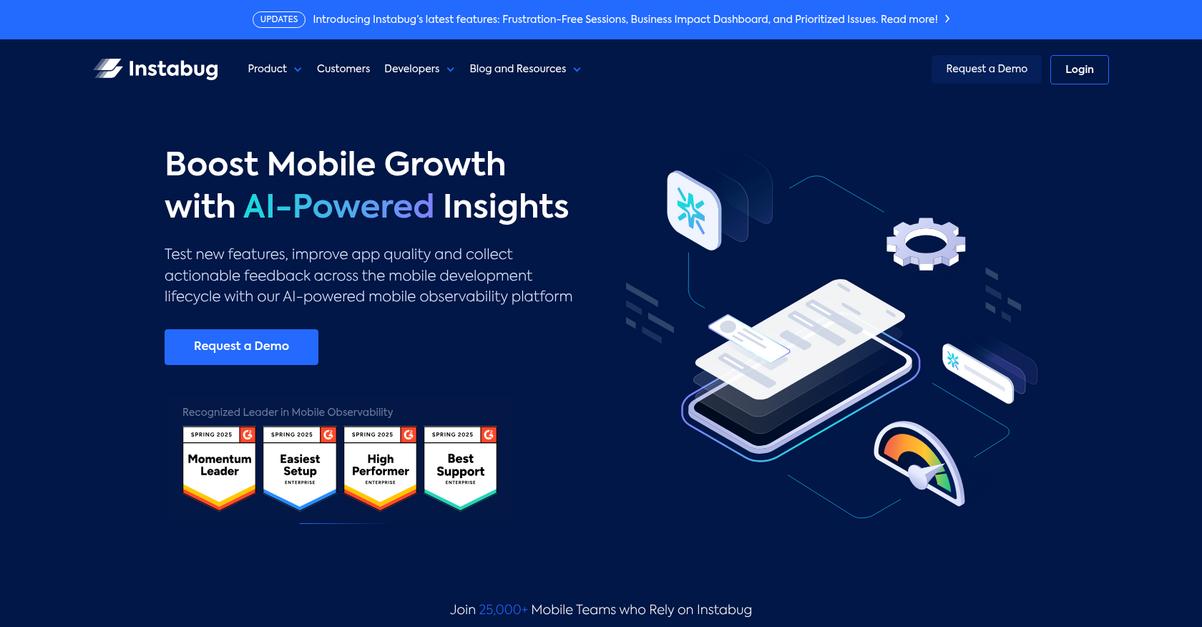
Instabug helps you proactively detect bugs and crashes, releasing seamless apps faster. This means you can pinpoint issues swiftly, ensuring your team isn’t wasting precious hours on manual bug hunting. It transforms user frustration into business success.
You need solutions that transition deeper into your development lifecycle.
Instabug’s AI-powered mobile observability platform helps you balance innovation and app stability. This includes comprehensive performance monitoring, crash analytics, and robust bug reporting. You can track and organize release-specific metrics, which empowers your developers to quickly assess urgent situations and strategize the best solutions faster. The platform also offers Session Replay, allowing you to see exactly what users experienced, and In-App Surveys to collect actionable feedback.
The result? Exceptional app performance.
While we’re discussing optimizing your digital presence, understanding link management tools is equally important for SEO success.
Key features:
- AI-Powered Mobile Observability: Delivers smarter insights to optimize mobile app performance and user experience, enabling faster issue resolution and proactive user experience optimization.
- Proactive Bug & Crash Detection: Test your app before every release with automated reproduction of crashes and bugs, eliminating the need to maintain breadcrumbs for issue replication.
- Actionable User Feedback Collection: Harnesses user insights through Bug Reporting, In-App Surveys, and App Ratings & Reviews to continuously enhance app quality.
Instabug features, pricing, & alternatives →
Verdict: For engineering managers and developers seeking to resolve bugs faster and boost code quality, Instabug stands out as best debugging software. Its AI-powered insights, automated reproduction, and user-centric approach help 25,000+ mobile teams achieve 99.9% crash-free apps, as seen with Verizon.
5. New Relic
Struggling to find bugs in your complex codebase?
New Relic offers intelligent observability with over 50 capabilities, directly addressing the pain point of wasted hours on manual bug hunting. This means you can finally gain full-stack visibility.
You can resolve issues up to 5x faster with intelligent transaction observability, allowing you to focus on the data and stack that matter most.
It’s time to simplify your debugging efforts.
New Relic solves complex debugging by providing a unified platform to monitor your full stack, including front end, back end, infrastructure, and logs. This helps you identify and diagnose errors across distributed environments.
You can gain critical insights into your applications with features like Transaction 360, Logs, and Alerts, enabling quick error replication and tracking. Additionally, its integrations with various programming languages and systems tear down silos.
Plus, you get robust security, including SOC2 Type II verification, ensuring your sensitive data is protected while you troubleshoot. The platform’s ability to integrate many tools helps bring your product teams and engineers closer together, boosting overall productivity.
This empowers your team to ship stable products faster.
Key features:
- Full-stack observability: Monitor your entire software environment, from front end to infrastructure, and logs, for comprehensive bug identification and diagnosis.
- Intelligent transaction observability: Resolve issues up to 5x faster by focusing on the most critical transaction data and stack information.
- Extensive integrations: Connect with over 780 tools and languages like Java, Python, and .NET, streamlining your existing development and operations workflows.
New Relic features, pricing, & alternatives →
Verdict: New Relic is an excellent choice as a best debugging software solution, especially if you’re a large engineering team. Its intelligent observability and comprehensive full-stack monitoring capabilities help reduce your mean time to resolution (MTTR) within 15 minutes, as reported by Vault Health.
6. BrowserStack
Struggling to deliver bug-free apps across all platforms?
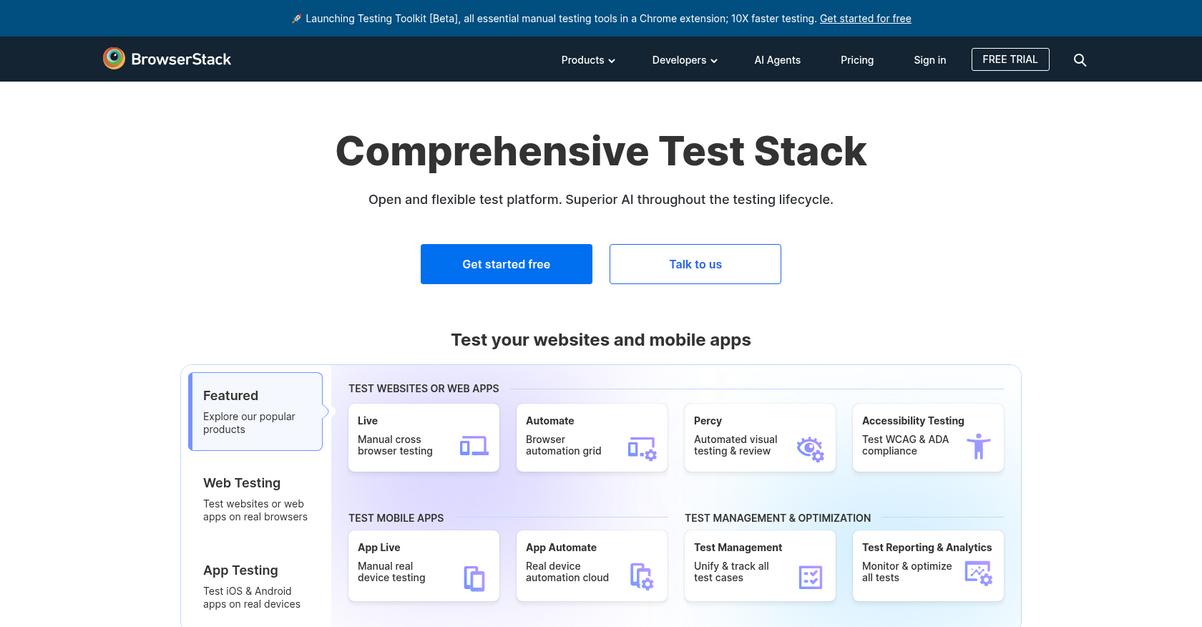
BrowserStack offers comprehensive test stacks, from web to mobile, on real browsers and devices. This eliminates tedious manual testing.
You can instantly access dev tools in a VM, allowing you to resolve bugs faster and boost your code. This means fewer wasted hours on bug hunting.
Here’s how to fix it.
BrowserStack helps you achieve faster, more reliable test automation at scale, crucial for meeting tight release deadlines. It lets you automate testing without coding, making it accessible to more team members.
You can integrate BrowserStack seamlessly into your existing CI/CD pipeline, running automated tests on every commit and getting results directly in Jenkins and Slack. Furthermore, you can report bugs directly to Jira and reproduce them with a click, significantly reducing your time-to-resolution. Their AI agents also boost productivity across your entire testing lifecycle by harnessing a unified data store.
The result? Deliver stable products faster and focus on innovation.
While we’re discussing debugging and code quality, having the best writing tools can also enhance your documentation and communication.
Key features:
- Real Device & Browser Testing: Test your websites on real browsers and mobile apps on over 20,000 real iOS and Android devices, ensuring comprehensive coverage and accurate bug replication.
- Automated & Visual Testing: Automate web and mobile app tests, including visual testing with Percy, to identify discrepancies and ensure consistent user experiences across platforms.
- Integrated Bug Capture & Reporting: Quickly capture, report, and resolve bugs with direct integrations to tools like Jira, streamlining your debugging workflow and improving team collaboration.
BrowserStack features, pricing, & alternatives →
Verdict: For teams needing a robust and flexible platform to manage the complexities of cross-platform development, BrowserStack stands out as a best debugging software. Its ability to lower developer pain and cut testing time by 90%, as seen with GoodRx, makes it ideal for accelerating release cycles and improving code quality.
7. Sauce Labs
Struggling with elusive bugs and missed release deadlines?
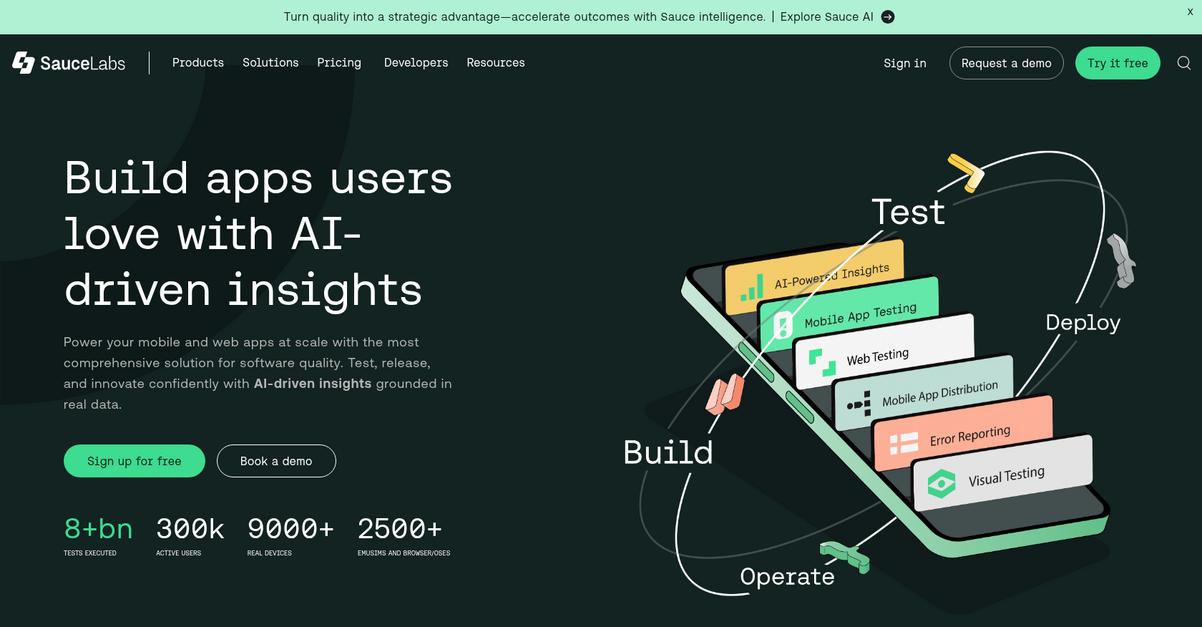
Sauce Labs offers a comprehensive solution for software quality, built to power your mobile and web apps at scale. This means you can confidently test, release, and innovate.
The platform provides a unified view for continuous quality, featuring the widest selection of real devices, virtual emulators, and extensive browser/OS support to catch issues early.
Here’s how to resolve bugs faster.
Sauce Labs solves these challenges by providing AI-driven insights from billions of raw data points, transforming them into actionable intelligence.
You can find and fix crashes up to 50% faster with their Error Reporting feature, gaining early warnings for production issues. This capability helps improve team collaboration and accelerate overall software quality.
Additionally, Sauce Labs offers Mobile App Distribution for secure app sharing, Mobile App Testing on thousands of real and virtual devices, and Web Testing with scalable infrastructure for parallel tests. Plus, Visual Testing automates UI checks, ensuring pixel-perfect experiences.
Boost your code with confidence.
Key features:
- AI-Powered Insights: Leverages billions of data points to deliver real-time analytics and visibility, allowing your team to track performance and act quickly.
- Error Reporting: Identifies and helps fix crashes up to 50% faster by providing early warnings for production errors and improving team collaboration.
- Comprehensive Test Coverage: Accesses the widest selection of over 9000 real devices, 2500+ emulators/simulators, and browsers/OSes for thorough testing.
Sauce Labs features, pricing, & alternatives →
Verdict: Sauce Labs stands out as a strong contender for best debugging software due to its enterprise-ready, AI-driven platform. With features like visual testing, error reporting, and comprehensive device coverage, it helps your teams ensure quality and accelerate innovation, as demonstrated by customers like Walmart who ensure app functionality across 700+ browser/OS combinations.
8. SmartBear
Are you struggling to pinpoint and resolve those elusive software bugs?
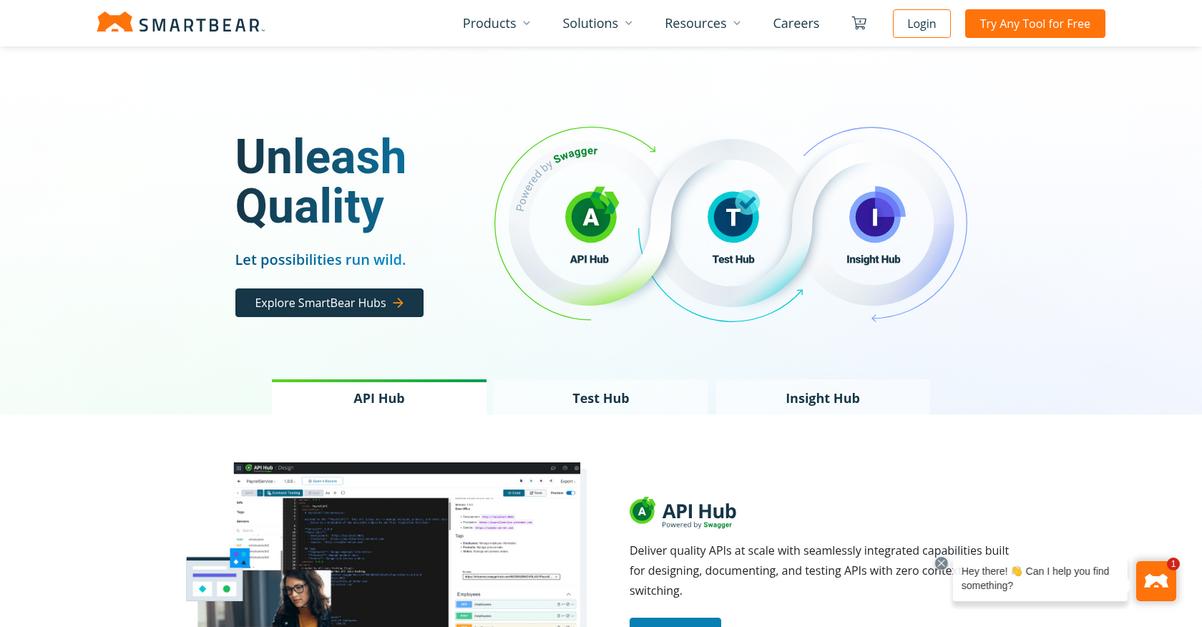
SmartBear offers specialized tools within its Insight Hub, designed to help you debug and maintain application stability.
This includes Error Monitoring, allowing you to resolve bottlenecks and improve responsiveness directly within your application.
Here’s how you can boost your code.
SmartBear’s Insight Hub helps you troubleshoot application errors and performance bottlenecks, tracing them back to the end-user experience to maximize application quality.
Its Performance Monitoring capability helps you resolve bottlenecks and improve responsiveness, while Distributed Tracing allows you to trace issues across services for comprehensive debugging.
Additionally, the Test Hub elevates your entire testing process with tools to manage, automate, and execute all your tests in one place, guaranteeing app quality, and ensuring seamless integration across your existing toolkit for easier and more efficient development.
Deliver with confidence.
Before diving deeper, you might find my analysis of patient engagement software helpful if you’re also looking for healthcare solutions.
Key features:
- Error Monitoring: Pinpoint and troubleshoot application errors and performance bottlenecks, directly impacting application stability and responsiveness.
- Distributed Tracing: Trace issues across various services, providing a clear path to resolution for complex, interconnected problems.
- Automated UI Functional Testing: Elevate your testing process by automating UI functional tests, managing and executing tests to guarantee app quality.
SmartBear features, pricing, & alternatives →
Verdict: SmartBear’s focus on error monitoring, distributed tracing, and automated UI testing makes it a strong contender as the best debugging software for developers and engineering managers who need to efficiently resolve issues and ensure application stability. Their tools empower teams to deliver quality software faster.
9. Telerik
Are you tired of endless bug hunts?
Telerik provides robust testing and debugging tools like Test Studio and Fiddler Everywhere, helping you pinpoint issues rapidly. This means you can significantly cut down on the wasted hours typically spent on manual bug hunting.
Additionally, with Telerik JustMock, you gain a flexible .NET mocking solution for rapid unit testing, which boosts your team’s productivity and code quality.
Streamline your debugging workflow today.
Telerik helps you conquer complex codebases by offering specialized tools for testing and debugging. For instance, Test Studio enables automated UI testing for web, WPF, and responsive applications, covering functional, regression, load, and RESTful API testing. This comprehensive coverage means fewer production errors for you.
Fiddler Everywhere allows you to inspect network traffic, mock requests and responses, compose API calls, and collaborate with your team to debug issues faster. Plus, with AI Coding Assistants integrated into Telerik’s offerings, you can enhance developer productivity further, ensuring stable products ship faster.
Ship stable products and innovate more.
While optimizing code is paramount, ensuring your applications reach a wide audience is equally important. My guide on Best App Store Optimization Tools offers valuable insights for mobile app success.
Key features:
- Automated UI Testing: Test Studio and Test Studio Dev Edition automate UI testing for web, WPF, and responsive applications, supporting functional, regression, load, and RESTful API testing.
- Network Traffic Inspection: Fiddler Everywhere helps you inspect network traffic, mock requests and responses, compose API calls, and collaborate for faster debugging and issue resolution.
- Rapid Unit Testing: Telerik JustMock provides a flexible and fully-featured .NET mocking solution, empowering you to perform rapid unit testing and enhance code quality.
Telerik features, pricing, & alternatives →
Verdict: If you’re seeking the best debugging software to resolve complex bugs faster and boost your code quality, Telerik is a top contender. Their integrated solutions, including automated UI testing, network traffic inspection, and rapid unit testing, empower your team to meet tight deadlines and deliver reliable applications with confidence.
10. JetBrains

Tired of battling stubborn bugs in your code?
JetBrains offers integrated development environments (IDEs) with powerful debugging tools. This means you can quickly pinpoint and resolve issues.
These tools provide an efficient way to identify and fix errors, saving you valuable time and effort. It’s about empowering your team.
How do you tackle those elusive bugs?
JetBrains helps you gain deep insights into your running applications, no matter the platform. You can efficiently navigate through code, set breakpoints, and inspect variables.
This helps you understand execution flow and diagnose issues faster and with greater precision. Additionally, its robust tools integrate with various technologies, supporting your specific development environment.
Plus, you can get intelligent code assistance, refactoring capabilities, and version control integration, all designed to streamline your workflow and improve code quality. The result is boosted productivity.
While focusing on software efficiency, you might also find my guide on best SaaS billing software helpful for managing business operations.
Key features:
- Integrated debugging tools: Pinpoint and resolve issues quickly across various platforms, enhancing your ability to understand and fix application behavior.
- Intelligent code assistance: Get smart suggestions and refactoring capabilities that help you write cleaner code and prevent bugs before they even occur.
- Seamless workflow integration: Effortlessly combine debugging with version control and other development processes, making your entire development cycle more efficient.
JetBrains features, pricing, & alternatives →
Verdict: For developers and engineering managers seeking to conquer complex codebases and meet tight deadlines, JetBrains stands out as a strong contender for best debugging software. Its integrated tools and intelligent features offer a comprehensive solution to reduce resolution times and ship stable products faster.
Conclusion
Tired of shipping buggy code?
Wasting hours on manual bug hunting is frustrating and pushes your deadlines further away. Choosing the right tool from a crowded market is tough but critical.
The right tools are a true game-changer. A Data Insights Market report projects the market growth to $7.2 billion by 2032, proving their value. This reflects a massive shift towards smarter, faster troubleshooting.
So, what’s my top recommendation?
From my experience, Sentry is the clear winner for resolving issues efficiently and keeping your development pipeline moving smoothly and incredibly fast.
Sentry excels by providing the full context needed to fix bugs in minutes, not hours. It’s the best debugging software because it traces errors to the exact commit.
While you focus on debugging, streamlining other business operations is also key. For powerful solutions, my guide on best vendors management software offers valuable insights.
I highly recommend you start a free trial of Sentry to see the immediate impact it makes on your entire workflow.
Ship stable products with confidence.