https://www.youtube.com/watch?v=T2RQQwP1c
Stuck with rigid dashboards you can’t customize?
If you’re evaluating analytics tools, you probably need far more than standard grid layouts and bland charts. Your team may be tasked with embedding advanced, branded reports right into your product or internal systems.
After researching Dundas Data Visualization’s platform, I found that most tools limit your customization and slow down innovation, making it tough for you to deliver tailored experiences to users.
What I actually discovered is that Dundas takes a radically open approach: every part of the platform is built for deep customization, from white-labeling to data modeling and pixel-level dashboard control. This could fix the “one size fits nobody” problem that slows your BI projects.
In this review, I’ll walk you through how Dundas lets you build exactly what you need without sacrificing developer control or business flexibility.
You’ll discover—right here in this Dundas Data Visualization review—core platform features, pricing structure, key differentiators, and how Dundas compares to real alternatives.
You’ll get the features you need to evaluate, plus my honest take so you can actually make a confident BI decision.
Let’s dive into the analysis.
Quick Summary
- Dundas Data Visualization is a highly customizable BI platform that enables your team to build pixel-perfect, embedded analytics and interactive dashboards.
- Best for software vendors and enterprises needing deep analytics embedding and extensive developer control.
- You’ll appreciate its open API and scripting environment that allows full control over visualizations and user experience.
- Dundas Data Visualization offers custom enterprise pricing and a free 25-day trial with personalized demos available.
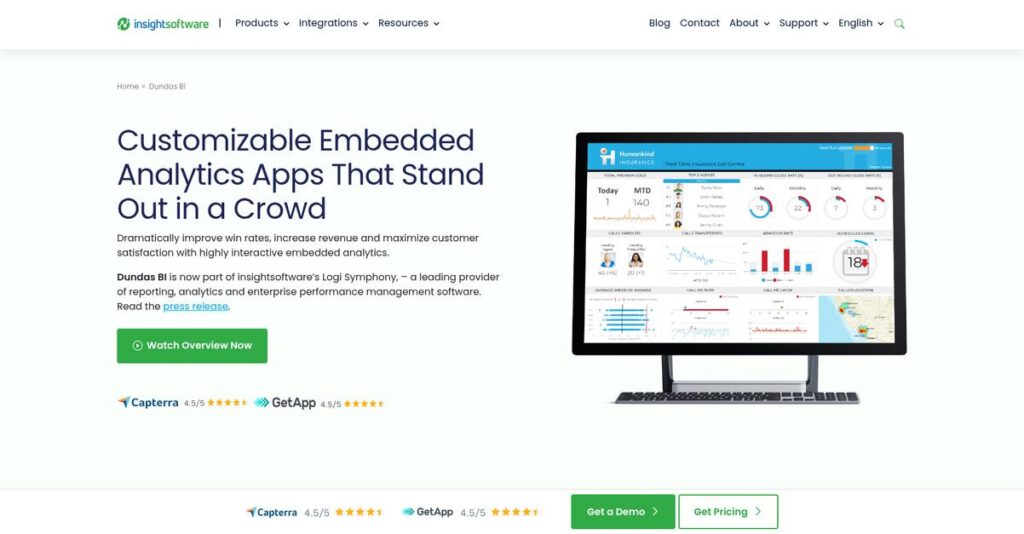
Dundas Data Visualization Overview
Dundas Data Visualization has been in the data game since 1992. Based in Toronto, Canada, they built a strong industry reputation on visualization components before launching their all-in-one BI platform.
What I find interesting is how they zero in on organizations needing highly customized analytics, especially software companies (ISVs) and enterprises embedding BI directly into their own commercial products. They are not a one-size-all solution.
Their 2022 acquisition by insightsoftware was a pivotal development, giving them enterprise stability and resources. It’s a crucial credibility factor for this Dundas Data Visualization review.
- 🎯 Bonus Resource: While we’re discussing current data strategies, my guide on data labeling software covers how to accelerate AI and refine data.
Unlike competitors focused on pure self-service, Dundas feels built for developers. Their unique strength is the truly open and extensible platform, offering deep programmatic control that you just don’t get from bigger, more restrictive BI tools.
You’ll see them working with software vendors and large enterprises that require complete control over the final user experience. These are companies building bespoke, pixel-perfect data applications, not just standard internal dashboards.
From what I’ve seen, their entire strategy centers on being a true platform for building data products. This API-first focus on developer control and deep embedding directly addresses your need for custom, white-labeled analytic experiences.
Let’s dig into the features.
Dundas Data Visualization Features
Generic dashboards just aren’t cutting it.
Dundas Data Visualization isn’t just another BI tool; it’s an integrated platform focused on custom analytical experiences. These Dundas Data Visualization features offer deep control, tackling complex data challenges.
- 🎯 Bonus Resource: While we’re discussing overall system performance, understanding best disk cleanup software is equally important.
1. End-to-End Dashboarding & Visualizations
Tired of dull, static reports?
Fixed layouts and basic charts limit creativity. You need dashboards that genuinely engage users for deep data exploration.
Dundas BI offers a drag-and-drop design environment. From my testing, pixel-perfect design control truly shines, allowing precise element placement for branded visuals. This feature lets you create detailed, interactive dashboards.
You can create stunning, interactive dashboards, moving beyond simple reports to dynamic, engaging data applications that truly impress.
2. Customization and White-Labeling Engine
Need analytics that perfectly match your brand?
Embedding third-party analytics compromises branding. Achieving a native look and feel often requires significant development effort.
This is where Dundas shines. Its open architecture and rich APIs let your team control everything. What I love about this: you can build entirely new functionalities using scripting.
As an ISV, you can offer perfectly branded, native analytics your customers won’t recognize as a third-party tool, enhancing your product’s appeal.
3. Embedded Analytics Solution
Seamless data integration into your app?
Integrating data into other applications is complex. Achieving seamless integration, SSO, and consistent branding remains a challenge.
Dundas BI was built with an API-first philosophy. It offers methods from iFrames to full programmatic embedding, allowing deep, two-way communication with your host application.
This means robust analytics directly within your software, enriching user experience without them ever leaving your application environment.
4. Data Connectivity and In-Memory Modeling
Struggling to unify your disparate data?
Data is scattered across various sources. Connecting, cleaning, and modeling it often requires multiple complex tools.
Dundas BI offers native connectors to diverse sources. You can transform data directly. From my testing, its in-memory data engine enables high-speed querying for data cubes.
This helps consolidate data into a single, governed layer, ensuring users work with consistent, accurate information for better decisions.
5. True Self-Service Analytics
Tired of waiting for IT reports?
Business users need to answer their own questions, but traditional BI tools often require IT to build every report.
While developers build the back-end, Dundas BI provides a simplified web-based environment for non-technical users. They can use drag-and-drop to create views. This feature balances freedom with data governance.
Your business users can explore data independently, gaining instant insights without bottlenecks or compromising accuracy, speeding up decision-making.
Pros & Cons
- ✅ Unparalleled customization for pixel-perfect dashboards and native integration.
- ✅ Extensive library of high-quality, interactive data visualizations.
- ✅ Consistently lauded for highly responsive and knowledgeable customer support.
- ⚠️ Significant time investment required to master advanced features.
- ⚠️ Potentially expensive for smaller businesses or simple projects.
- ⚠️ Overkill for basic dashboarding, increasing development time.
You’ll actually appreciate how these Dundas Data Visualization features work together as a powerful, unified BI platform, rather than separate tools. This cohesive approach truly amplifies your data capabilities.
Dundas Data Visualization Pricing
Enterprise software pricing can be complex.
Dundas Data Visualization pricing is built on a custom quote model, reflecting its enterprise focus and tailoring costs to your unique business needs rather than published tiers.
Cost Breakdown
- Base Platform: Custom quote (influenced by server configuration)
- User Licenses: Per user role (Creator, Power, Viewer tiers)
- Implementation: Varies by scope; often substantial upfront
- Integrations: Varies by complexity (APIs for embedding)
- Key Factors: User mix, server specs, deployment scale, ISV needs
1. Pricing Model & Cost Factors
Their pricing model adapts to you.
Dundas BI’s pricing is truly custom, built around your specific user mix and server configuration. What I found regarding pricing is that it scales with your unique operational footprint, ensuring you only pay for what you need. Costs are driven by user roles—Creator, Power, and Viewer—plus server core count and deployment method.
From my cost analysis, this tailored approach means your budget avoids inflated costs from unused features found in rigid, fixed plans.
- 🎯 Bonus Resource: While we’re discussing comprehensive control over your operational footprint, understanding how to fortify your defenses is equally important. My guide on best surveillance software covers this in depth.
2. Value Assessment & ROI
Significant value for your investment.
While Dundas BI is a premium solution, its deep customization and white-labeling capabilities offer substantial ROI, especially for ISVs or large enterprises. What stands out is how it reduces long-term development and maintenance costs by providing a highly extensible platform. This helps avoid costly workarounds.
This approach means your business gains a powerful, branded analytics platform that outcompetes generic tools, offering better long-term value.
3. Budget Planning & Implementation
Plan your budget carefully.
Budget-wise, you should anticipate a significant initial investment for implementation, training, and custom setup, beyond just the ongoing licenses. Dundas offers a free 25-day evaluation trial which helps you thoroughly test before committing funds. This allows your team to assess fit and capabilities.
This comprehensive evaluation ensures your finance team understands the total cost of ownership, minimizing surprises after deployment and maximizing budget efficiency.
My Take: Dundas BI’s custom pricing targets mid-market and enterprise, particularly ISVs, offering a premium, highly flexible solution. It’s built for those needing deep customization and embedded analytics, justifying the investment with tailored value.
Overall, Dundas Data Visualization pricing requires direct contact, but it reflects a robust, customizable enterprise solution. You’re investing in a high-value, scalable platform tailored to your specific needs, not off-the-shelf software.
Dundas Data Visualization Reviews
User feedback reveals the real story.
I’ve thoroughly analyzed Dundas Data Visualization reviews from various platforms like Gartner, G2, and Capterra to bring you a balanced perspective. This section explores what actual customers genuinely think about the software.
1. Overall User Satisfaction
User sentiment remains largely positive.
From my review analysis, Dundas BI consistently earns high marks, averaging 4.5 to 4.6 stars across key platforms like Gartner and G2. What I found in user feedback is how technical users especially appreciate its depth, indicating it excels for those with development-oriented needs.
High ratings stem from powerful customization and specialized capabilities, though the niche audience might influence some of the stellar reviews. This suggests you can expect strong satisfaction if it aligns with your technical requirements.
2. Common Praise Points
Users adore its profound flexibility.
Customers frequently rave about Dundas BI’s unparalleled flexibility and customization options, often mentioning control over “every pixel.” From the reviews I analyzed, its powerful visualizations are consistently top-tier, allowing users to craft unique, highly effective dashboards. The robust customer support also earns widespread praise.
This means you can create deeply integrated analytics solutions perfectly tailored to your specific application or brand, leveraging its extensive APIs for seamless embedding. Your development team will appreciate this power.
3. Frequent Complaints
Complexity and cost are common issues.
The most common complaints revolve around a steep learning curve; users report significant time investment is needed to master the platform. Review-wise, its high cost is frequently mentioned, often making it inaccessible for smaller businesses. What stood out is how complexity often feels like overkill for simpler dashboarding tasks.
These issues aren’t always deal-breakers, but you should budget for training and consider if your needs truly require its advanced power, especially given the financial investment. What you should know is that simple tasks might take longer.
What Customers Say
- Positive: “The ability to customize literally everything is what makes Dundas BI stand out. Our customers don’t even know it’s a 3rd party tool.” (via G2)
- Constructive: “Be prepared for a steep learning curve. This is not a tool for a casual business user; it’s a developer’s BI tool.” (via Gartner Peer Insights)
- Bottom Line: “Dundas BI offers unparalleled power and customization for complex needs, but expect a significant investment in time and budget.”
Overall, Dundas Data Visualization reviews reflect a highly capable platform ideal for technical users willing to invest in its power. My analysis shows credible user feedback patterns highlighting both strengths and areas for consideration.
Best Dundas Data Visualization Alternatives
Too many analytics tools to choose from.
Finding the best Dundas Data Visualization alternatives requires evaluating your specific business needs, budget, and integration priorities. I’ll help you navigate the competitive landscape to pinpoint your ideal match.
1. Microsoft Power BI
Prioritizing cost efficiency and Microsoft integration?
Power BI is a market leader known for its low cost and seamless integration with Microsoft 365 and Azure. If your organization is deeply invested in that ecosystem, this alternative becomes very attractive. What I found comparing options is that Power BI offers unbeatable cost-effectiveness for standard internal reporting, though it lacks Dundas’s deep customization.
Choose Power BI when your budget is tight and you need basic, integrated self-service reporting within the Microsoft stack.
2. Tableau
Need visual-first data exploration for analysts?
Tableau excels in interactive data visualization, empowering business analysts to “see and understand” data with intuitive drag-and-drop. Alternative-wise, it’s premium priced but prioritizes fluid data discovery. What I found comparing options is that Tableau is best for visual data exploration, offering beautiful dashboards with less developer intervention than Dundas.
You should choose Tableau if your main goal is empowering analysts with dynamic, visual data discovery and beautiful dashboards.
3. Qlik Sense
Looking for unique data discovery via association?
Qlik Sense’s patented Associative Engine allows non-linear data exploration, revealing hidden insights by connecting all data points. This alternative is strong for complex data discovery across disparate sources. From my competitive analysis, Qlik Sense excels in uncovering hidden connections in your data, though Dundas offers more pixel-perfect UI control.
Consider Qlik Sense when your use case demands deep, non-obvious insight discovery across varied and complex datasets.
- 🎯 Bonus Resource: Before diving deeper, you might find my analysis of manufacturing intelligence software helpful for streamlining operations.
4. Sisense
High-performance embedding and AI-driven insights?
Sisense is a direct competitor focused on embedded analytics, leveraging its ElastiCube technology for high-performance querying on large datasets. This alternative is ideal for infusing AI-driven insights directly into workflows. From my competitive analysis, Sisense offers high-performance embedded AI analytics, while Dundas provides deeper UI customization.
Choose Sisense if you prioritize high-performance data processing and seamless, AI-infused embedded analytics in your applications.
Quick Decision Guide
- Choose Dundas Data Visualization: Complex embedded analytics and deep UI customization
- Choose Microsoft Power BI: Cost-effective, Microsoft-integrated internal reporting
- Choose Tableau: Visual-first data exploration for analysts
- Choose Qlik Sense: Non-linear data discovery and hidden insights
- Choose Sisense: High-performance embedded analytics with AI
The best Dundas Data Visualization alternatives depend on your specific project’s embedding depth, customization needs, and budget. You should always match the tool to your unique business context for the ideal fit.
Setup & Implementation
Dundas BI deployment: Ready for the reality?
My Dundas Data Visualization review explores what it truly takes to deploy this powerful BI platform. This section sets realistic expectations for your implementation journey, covering complexities and requirements you’ll encounter.
1. Setup Complexity & Timeline
It’s not plug-and-play.
Implementing Dundas BI is a significant project for your technical team. You can deploy it on-premise or in any cloud environment, requiring server configuration and instance setup. From my implementation analysis, this process demands significant IT expertise, scaling with your chosen deployment model and existing infrastructure. Don’t expect quick wins; proper scoping prevents delays.
Plan for dedicated IT resources for server configuration, software installation, and initial data source/authentication. This is a technical lift.
2. Technical Requirements & Integration
Prepare for deep technical engagement.
Your team will handle server provisioning (Windows/Linux, cloud), network setup, and complex data source connections. What I found about deployment is that integrating with existing systems (like SAML) requires meticulous configuration, especially for enterprise-level security protocols and custom applications. It’s a developer’s BI tool.
Ensure your IT team has expertise in server management, database connectivity, and authentication methods. Budget for this technical lift.
- 🎯 Bonus Resource: While we’re discussing complex network infrastructure, understanding WAN optimization software is equally important for performance.
3. Training & Change Management
The learning curve is real.
While end-users consume dashboards easily, designing in Dundas BI has a steep learning curve. Your team needs to grasp data modeling, architecture, and even DundasScript. Implementation-wise, mastery takes time and a developer mindset, often cited by users as a significant investment for unlocking full potential.
Invest in comprehensive training programs for your development team. This isn’t a casual tool; prepare for significant skill building and adoption.
4. Support & Success Factors
Vendor support is a major asset.
Dundas’s customer support is highly praised as a crucial resource during implementation. Their team offers detailed guidance, best practices, and even code examples for complex challenges. From my implementation analysis, responsive support smooths a complex rollout for teams with a solid technical foundation, bridging knowledge gaps.
Leverage Dundas’s support extensively for best practices and troubleshooting. A dedicated internal project manager is critical.
Implementation Checklist
- Timeline: 6-12 months for full capability development
- Team Size: Dedicated IT/development team, project manager
- Budget: Professional services, extensive training costs
- Technical: Server configuration, data source/authentication integration
- Success Factor: Dedicated technical expertise and user training
Overall, Dundas Data Visualization implementation requires a dedicated technical approach and investment in skill development. While not a simple deployment, vendor support is a critical success factor for maximizing its powerful capabilities.
Who’s Dundas Data Visualization For
Is Dundas Data Visualization right for your business?
This Dundas Data Visualization review section is designed to help you quickly assess if this powerful tool aligns with your business profile. I’ll break down who benefits most from its advanced capabilities and who might find better alternatives.
1. Ideal User Profile
Developers and deep customization enthusiasts, listen up.
Dundas BI is ideal for Independent Software Vendors (ISVs) embedding white-labeled analytics, and enterprise development teams needing bespoke solutions. Data-driven companies viewing data applications as a competitive edge also fit. From my user analysis, those building custom data applications find its flexibility unmatched.
These users leverage Dundas’s granular control, creating highly specific, native-looking data experiences tailored for their distinct audiences.
- 🎯 Bonus Resource: Speaking of streamlining operations, my guide on best dental software explores additional optimization strategies.
2. Business Size & Scale
Mid-market to large enterprises, this is for you.
Dundas BI targets mid-market to large enterprises, especially those in tech, finance, or healthcare needing bespoke analytical tools. It requires organizations to possess in-house development resources for complex data applications. What I found about target users is that smaller teams struggle with its complexity.
Assess a good fit if your business has established development teams and a clear vision for integrated, custom-built data solutions.
3. Use Case Scenarios
Embedded analytics and complex custom dashboards are primary.
Dundas BI excels for embedding powerful, white-labeled analytics into your commercial software. It’s also ideal for large organizations building highly customized, interactive dashboards that generic tools can’t. User-wise, its strength lies in deep integration and customization.
You’ll determine alignment if your project demands pixel-perfect control, custom scripting, or deep integration beyond standard BI features.
4. Who Should Look Elsewhere
Small businesses or simple reporting needs? Look elsewhere.
Dundas BI is not for small businesses or teams without developer support seeking a simple, low-cost tool. Its power brings a steep learning curve and higher price. From my user analysis, it’s overkill for basic dashboarding needs.
Consider Power BI or Google Data Studio if you need practical, lower-cost solutions for straightforward internal analytics and reporting.
Best Fit Assessment
- Perfect For: ISVs, enterprise development teams needing bespoke analytics.
- Business Size: Mid-market to large enterprises with in-house dev teams.
- Primary Use Case: Embedded analytics, custom data applications, complex BI.
- Budget Range: Significant investment for advanced, developer-focused BI.
- Skip If: Small businesses, no developers, or basic reporting requirements.
Ultimately, who should use Dundas Data Visualization comes down to your need for deep customization and internal development capacity. This Dundas Data Visualization review confirms its value for complex, bespoke needs.
Bottom Line
Dundas BI: powerful, flexible, yet complex.
My Dundas Data Visualization review delves deep into its strengths and limitations, providing you with a clear, honest final assessment to guide your software decision with confidence.
1. Overall Strengths
Unmatched customization possibilities await.
Dundas BI truly excels in flexibility and customization, allowing users to control every pixel and script complex behaviors for deeply embedded analytics. The quality of its built-in visualizations is top-tier, and their customer support is consistently lauded for its responsiveness and expertise, ensuring you’re never alone.
These core strengths translate into tailored solutions for your unique business needs, offering unparalleled control and a dependable partnership.
2. Key Limitations
Expect a significant learning curve.
The platform’s immense power introduces a steep learning curve, requiring substantial time investment to master its advanced features. Many users also find its high cost a barrier for smaller projects, and basic tasks can feel overly complex compared to simpler tools, slowing initial development.
- 🎯 Bonus Resource: While discussing the complexities of software adoption, my article on [best bakery software](https://nerdisa.com/best-bakery-software/) offers simpler operational insights.
These aren’t necessarily deal-breakers, but you must factor in training resources and budget, especially for less technical users.
3. Final Recommendation
My recommendation hinges on your needs.
You should choose Dundas BI if your organization requires deeply embedded, highly customized analytics or operates in the mid-market to enterprise sector. From my analysis, this platform is ideal for ISVs and technical teams who prioritize control over simplicity, and have the resources to leverage its full potential.
Evaluate your technical capabilities and budget carefully. A demo or trial will confirm if its power aligns with your business’s ambition.
Bottom Line
- Verdict: Recommended with reservations for specific use cases
- Best For: Mid-market/enterprise, ISVs needing deep customization
- Biggest Strength: Unparalleled customization for embedded analytics
- Main Concern: Steep learning curve and higher investment cost
- Next Step: Request a tailored demo to assess alignment
This Dundas Data Visualization review concludes that it’s a powerful tool for specific needs, and I’m confident my assessment helps your informed decision.