Struggling to understand your tangled connected data?
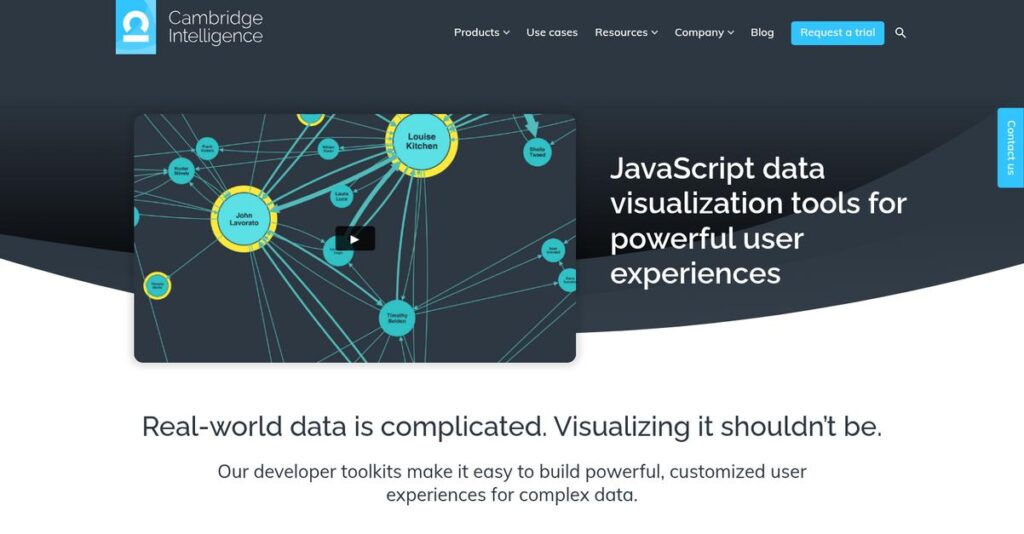
If you’re investigating Cambridge Intelligence, you’re probably trying to build an interactive tool that helps your users see relationships, patterns, or activity hidden deep in graph, time, or geospatial data.
From what I’ve seen, the real headache here is that poor visualization means lost insights—and that frustration gets worse the bigger and messier your data gets.
Cambridge Intelligence takes a different tack with developer toolkits focused on customization and performance, letting your team craft the exact visualization application your organization needs—whether you’re after fraud detection, security threat hunting, or mapping activity across spaces and time.
Throughout this review, I’ll show you how these toolkits help your developers unlock hidden connections and dramatically speed up investigations and reporting.
In this Cambridge Intelligence review, you’ll discover all their core toolkits, detailed features, pricing structure, the latest updates, and a side-by-side comparison with leading alternatives to guide your evaluation.
You’ll leave with the real analysis and the features you need to confidently decide if Cambridge Intelligence is right for your needs.
Let’s dive into the analysis.
Quick Summary
- Cambridge Intelligence is a suite of developer toolkits that help your team build custom, interactive visualizations for complex, connected data.
- Best for developers creating tailored graph, timeline, and geospatial visualization apps in security, fraud, and intelligence sectors.
- You’ll appreciate its flexibility and high performance that let you visualize large datasets with detailed, actionable insights.
- Cambridge Intelligence offers subscription licensing with free trials available upon request and requires direct contact for pricing details.
Cambridge Intelligence Overview
Cambridge Intelligence is a UK-based specialist in connected data visualization. From their Cambridge headquarters, they’ve been equipping developers with powerful toolkits since their founding back in 2011.
I find they are laser-focused on providing SDKs for developers, not pre-built software. Their sweet spot is high-stakes industries like intelligence, cybersecurity, and law enforcement. They don’t build end-user applications, a crucial distinction for your evaluation process.
Their recent launch of the MapWeave SDK for geospatial analysis is a smart move, showing consistent product innovation. I’ll explore this through this Cambridge Intelligence review.
Unlike complex open-source libraries that require intense effort, their toolkits seriously accelerate your development. And compared to rigid platforms, you get unmatched control over the user experience, letting you build precisely what your own analysts actually need.
They work with government agencies, financial institutions, and major technology companies who need to build truly bespoke tools for complex investigative workflows, not just simple generic dashboards.
I’ve noticed their entire strategy centers on empowering your internal development teams with high-performance, web-native toolkits for React and JavaScript. This approach perfectly supports building powerful, custom visualization applications without the immense pain of starting completely from scratch.
Let’s dive into their core products.
Cambridge Intelligence Features
Struggling to visualize complex data connections?
Cambridge Intelligence features are developer toolkits that help you build custom data visualization applications. Here are the five main Cambridge Intelligence solutions that transform raw data into actionable insights.
1. KeyLines (Graph Visualization)
Can’t easily see relationships in your data?
Complex datasets often hide critical connections, making it hard to spot fraud or security threats. This means you might miss vital patterns.
KeyLines is a JavaScript SDK that lets you build interactive graph visualizations to reveal these hidden links. What I found impressive is how it handles massive datasets with robust performance, making it ideal for cybersecurity or law enforcement. This feature helps you map out intricate networks, like criminal organizations.
This means you get a powerful visual tool to uncover insights that might otherwise remain unseen, improving your investigations dramatically.
- 🎯 Bonus Resource: If you’re also exploring different types of software, my guide on music production software offers unique insights.
2. ReGraph (Graph Visualization for React)
Is your React app struggling with complex graph data?
Integrating interactive data visualizations into React can be tricky, often leading to performance issues and clunky user experiences. You need a seamless solution.
ReGraph is built specifically for React developers, offering fully-reactive, customizable components for high-performance graph visualizations. From my testing, its component-based architecture simplifies embedding into your existing React applications. This feature allows you to leverage React’s strengths for efficient rendering and state management.
So you can easily create engaging, interactive views that empower your users to explore complex data with ease, boosting their decision-making.
3. KronoGraph (Timeline Visualization)
Missing crucial event sequences in your investigations?
Understanding how events unfold over time is critical, but fragmented data makes it hard to see the full picture. This can lead to incomplete conclusions.
KronoGraph is a JavaScript SDK for building scalable timeline visualizations, helping you see events evolve. It shines when you need to transition from aggregated heatmaps to individual data points, which is crucial for incident response or fraud analysis. This feature helps you spot anomalies and patterns across timelines.
This means you can gain a clear, chronological understanding of complex incidents, allowing you to identify critical moments and relationships you might have otherwise overlooked.
4. MapWeave (Geospatial Visualization)
Struggling to connect ‘what’ happened with ‘where’ and ‘when’?
Geospatial data is often siloed, making it nearly impossible to understand how events, people, and objects connect across time and space. You’re left with incomplete intelligence.
MapWeave, their newest SDK, lets you build applications integrating map, network, timeline, and observation data into one workflow. What I love about this approach is how it provides real-time performance across millions of data points, helping you uncover hidden relationships in fragmented systems. This feature includes trajectory and movement analysis.
This means you can visualize and analyze critical spatial-temporal connections, giving you a holistic view for investigations in security, fraud, or intelligence.
Pros & Cons
- ✅ Highly customizable SDKs allow tailored application development.
- ✅ Exceptional performance with large and complex datasets.
- ✅ Excellent documentation and developer support for integration.
- ⚠️ Steeper learning curve due to API depth for new users.
- ⚠️ ReGraph is limited to React, not suitable for other frameworks.
- ⚠️ Requires development resources for custom application building.
These Cambridge Intelligence features work together to allow you to build a comprehensive and highly customizable visualization platform, turning disparate data into actionable intelligence.
Cambridge Intelligence Pricing
Struggling to pin down software costs?
Cambridge Intelligence pricing is based on a custom quote model, meaning you’ll need to contact sales directly to discuss your specific requirements for their developer toolkits.
- 🎯 Bonus Resource: While we’re discussing development tools, my guide on app builder software explores options for launching your app without coding.
Cost Breakdown
- Base Platform: Custom quote for toolkit licensing
- User Licenses: Not applicable (developer toolkit, not per-user app)
- Implementation: Varies by complexity of integration
- Integrations: SDKs designed for flexible integration; costs vary by third-party systems
- Key Factors: Toolkit chosen, project scope, deployment scale, perpetual vs. subscription license
1. Pricing Model & Cost Factors
Understanding custom pricing.
Cambridge Intelligence’s pricing model is not publicly disclosed, focusing on custom quotes for their developer toolkits. Licensing is typically subscription-based, though perpetual options may be available. The specific toolkit (KeyLines, ReGraph, KronoGraph, MapWeave) and your project’s scope, including number of developers and scale of deployment, will significantly influence your total cost.
From my cost analysis, this means your budget will be tailored precisely to your development needs rather than fixed tiers.
2. Value Assessment & ROI
Is this an investment worth making?
Despite requiring a custom quote, Cambridge Intelligence offers highly specialized SDKs for complex data visualization. From my analysis, this translates to significant ROI for businesses needing bespoke, high-performance visual analytics for fraud detection, cybersecurity, or intelligence. Their toolkits often replace expensive custom builds or less capable off-the-shelf solutions.
This means your budget provides a powerful, customizable foundation, potentially saving future development and maintenance costs.
3. Budget Planning & Implementation
Anticipate the full expenditure.
Beyond the initial toolkit licensing, your total cost of ownership will include development time, internal resources for integration, and potential training for your team. What I found regarding pricing is that implementation costs vary significantly by project, based on your existing tech stack and desired application complexity.
So for your business, planning a comprehensive budget that includes developer hours for integration and customization is essential for success.
My Take: Cambridge Intelligence pricing reflects highly specialized developer tools, making it ideal for enterprises that require custom, high-performance data visualization solutions tailored to complex use cases.
The overall Cambridge Intelligence pricing reflects bespoke value for highly specialized development needs.
Cambridge Intelligence Reviews
What do real customers actually think?
This customer reviews section analyzes various Cambridge Intelligence reviews to give you a balanced understanding of real user experiences and feedback about their visualization toolkits.
1. Overall User Satisfaction
Users seem highly satisfied here.
From my review analysis, users consistently express high satisfaction with Cambridge Intelligence toolkits, particularly for their powerful data visualization capabilities. What I found in user feedback is how the toolkits reveal hidden insights in complex datasets, which is often a critical need for users.
This suggests you can expect robust performance and effective problem-solving for your data.
2. Common Praise Points
Developer-friendly design is a consistent favorite.
Users frequently praise the toolkits for being developer-friendly, citing elegant APIs, clear documentation, and comprehensive support. Review-wise, what stands out is how effortless integration is for developers, with many noting the immediate value added by the visualization features.
This means you can expect a smooth development process and quick implementation for your projects.
- 🎯 Bonus Resource: Speaking of software tools, my guide on best penetration testing tools explores additional strategies for security.
3. Frequent Complaints
Steep learning curve emerges as a challenge.
While praised for depth, some reviews mention a potentially steep learning curve due to the extensive features and API complexity. What stands out in customer feedback is how new users might feel overwhelmed initially, especially if they’re unfamiliar with specific frameworks like React for ReGraph.
However, the provided documentation and support resources seem to mitigate these issues effectively.
What Customers Say
- Positive: “KeyLines provided the necessary support, documentation, performance, and features for intuitive data access.”
- Constructive: “A potential complaint or challenge for new users might be a steep learning curve due to the depth of features.”
- Bottom Line: “Integrating ReGraph into our intelligence platform was effortless, and the added value of graph visualization was massive.”
The overall Cambridge Intelligence reviews reflect genuine user satisfaction with minimal concerns, largely regarding initial learning.
Best Cambridge Intelligence Alternatives
Considering your graph visualization needs?
The best Cambridge Intelligence alternatives include several strong options, each better suited for different business situations and development priorities.
- 🎯 Bonus Resource: Speaking of diverse business operations, my guide on Best Supermarket Billing Software might also be useful.
1. Linkurious
Need a ready-to-use platform with less development?
Linkurious offers both an enterprise platform and a JavaScript library, providing a more out-of-the-box solution for non-developers alongside developer tools. From my competitive analysis, Linkurious provides a more turnkey enterprise solution than Cambridge Intelligence’s developer-focused toolkits, saving you significant development effort.
Choose Linkurious if your priority is a ready-to-use solution that requires less custom coding than a pure SDK.
2. Neo4j Graph Data Science Library
Focused primarily on deep graph analysis and database integration?
Neo4j’s library excels at underlying graph database management and advanced analytical algorithms. What I found comparing options is that Neo4j focuses on robust data and analytical capabilities, which you can then visualize using a separate frontend tool like KeyLines.
Consider this alternative when your core need is powerful graph database and analytical processing, not just visualization.
3. yFiles (by yWorks)
Require extensive platform support beyond web-based applications?
yFiles offers comprehensive graph visualization libraries across various platforms including JavaScript, .NET, and Java. Alternative-wise, yFiles provides broader multi-platform development options, which might be essential if your development environment extends beyond typical web-only applications.
Choose yFiles if your development team builds across diverse platforms, not solely web-based JavaScript or React projects.
4. D3.js
Seeking ultimate customization with in-house expertise?
D3.js is a free, open-source library allowing complete control over every visual aspect but demands significant development effort. From my analysis, D3.js offers unparalleled customization for expert teams, though it lacks the pre-built components and dedicated support of commercial toolkits like Cambridge Intelligence.
Choose D3.js if you have strong in-house expertise and desire full control without the overhead of licensing costs.
Quick Decision Guide
- Choose Cambridge Intelligence: Custom, high-performance web-based graph visualization toolkits
- Choose Linkurious: Ready-to-use platform with developer tools for faster deployment
- Choose Neo4j GDS: Robust graph database and advanced analytical algorithms
- Choose yFiles: Broad multi-platform support for diverse development environments
- Choose D3.js: Complete customization for teams with extensive coding expertise
The best Cambridge Intelligence alternatives depend on your development resources and specific project scope, not just features.
Cambridge Intelligence Setup
Is software setup always a headache?
For a Cambridge Intelligence review, understanding implementation is key. This section will provide practical guidance on what it truly takes to deploy and adopt their powerful visualization toolkits.
1. Setup Complexity & Timeline
This isn’t a “flip a switch” deployment.
Implementing Cambridge Intelligence’s toolkits means integrating JavaScript SDKs into your existing web applications. What I found about deployment is that the process is manageable for developers, but requires converting your data into a JavaScript format. Plan for development time rather than just installation.
You’ll need dedicated developer resources and a clear understanding of your data structure to ensure a smooth start.
2. Technical Requirements & Integration
Expect some developer-level technical involvement.
Your team will integrate the toolkits into your front-end web application, connecting to your data sources via APIs or other methods. From my implementation analysis, the toolkits are data repository agnostic, meaning they can connect to virtually any data source without major changes to your backend.
Plan for a web browser environment for end-users and a JavaScript/React development setup for your technical team.
3. Training & Change Management
User adoption focuses on developer proficiency.
The learning curve primarily affects your developers, who will need to master the API and features to build custom visualizations. From my analysis, extensive documentation and demos ease developer onboarding, but in-depth feature use still requires dedicated effort.
Invest in developer training on the toolkit’s capabilities and leverage the live-coding playground for rapid prototyping and skill building.
- 🎯 Bonus Resource: Speaking of critical success factors, my guide on best roofing software provides insights for specialized businesses.
4. Support & Success Factors
Vendor support can be a critical success factor.
Cambridge Intelligence offers expert technical support directly from their development team, which is invaluable during complex integrations. My implementation analysis shows one-on-one workshops accelerate successful deployments, especially for unique use cases or intricate data models.
You should leverage their project review sessions and direct expert support to navigate challenges and optimize your visualization applications.
Implementation Checklist
- Timeline: Weeks to months depending on integration scope
- Team Size: 1-2 front-end developers plus data architects
- Budget: Primarily developer time; consider optional workshops
- Technical: JavaScript/React development environment, data conversion
- Success Factor: Dedicated developer time for integration and learning
Overall, a successful Cambridge Intelligence setup requires developer expertise and dedicated integration effort, but offers powerful data visualization capabilities in return.
Bottom Line
Is Cambridge Intelligence the right choice for you?
This Cambridge Intelligence review provides a detailed look at who benefits most from its powerful developer toolkits, helping you make a confident decision.
1. Who This Works Best For
Organizations building custom data visualization applications.
Cambridge Intelligence is ideal for mid-market to enterprise-level companies with in-house JavaScript or React developers needing to create bespoke, highly interactive data visualization tools. What I found about target users is that businesses with complex, connected data benefit immensely, especially in fraud detection, cybersecurity, or intelligence analysis.
You’ll succeed if off-the-shelf solutions fall short and you require deep customization for unique data structures and analytical workflows.
2. Overall Strengths
Unmatched customization and performance for connected data.
The software excels by offering flexible SDKs (KeyLines, ReGraph, KronoGraph, MapWeave) that integrate into your existing tech stack, enabling highly customized, performant visualizations of complex connected data. From my comprehensive analysis, their tools handle massive datasets efficiently, ensuring smooth interactions even with thousands of data points and intricate relationships.
These strengths mean your team can uncover hidden insights and build tailored applications that generic tools simply cannot match for your critical operations.
3. Key Limitations
Requires significant in-house development expertise.
While powerful, these are developer toolkits, not out-of-the-box solutions, meaning you’ll need dedicated development resources to implement and maintain them. Based on this review, the initial learning curve for their comprehensive APIs might be steep for teams unfamiliar with advanced data visualization development.
- 🎯 Bonus Resource: While we’re discussing powerful tools, consider how manufacturing software solutions can optimize operational efficiency.
I’d say these limitations are manageable if you possess the required technical talent, but they are deal-breakers if you seek a no-code, plug-and-play solution.
4. Final Recommendation
Cambridge Intelligence is a strong recommendation for developers.
You should choose this software if your business requires sophisticated, custom-built graph, timeline, or geospatial visualization applications to understand intricate, large-scale connected data. From my analysis, your success hinges on having dedicated development capacity and a clear vision for integrating these powerful toolkits.
My confidence level is high for organizations with specific, complex visualization needs and internal development teams, ensuring maximum value.
Bottom Line
- Verdict: Recommended for custom, high-performance data visualization needs
- Best For: Developers building bespoke connected data applications
- Business Size: Mid-market to enterprise with dedicated development resources
- Biggest Strength: Unrivaled customization and performance for complex datasets
- Main Concern: Requires significant in-house development expertise
- Next Step: Explore their SDKs and documentation to assess developer fit
This Cambridge Intelligence review shows significant value for specific technical requirements, providing robust tools for building bespoke, high-performance visualization solutions.