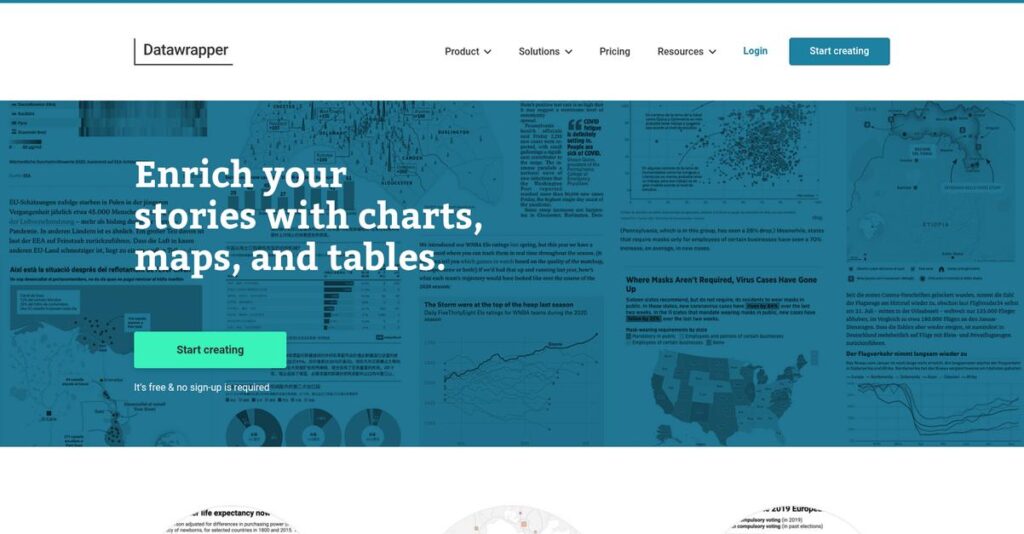
Struggling to make your data look clear?
If you’re searching for ways to turn raw numbers into professional charts and maps—without coding headaches—Datawrapper is probably on your radar right now.
Let’s be real: most so-called “easy” tools still leave you with confusing graphics and wasted time formatting every single graphic you build.
What stands out with Datawrapper is just how quickly you get from spreadsheet to interactive, polished visuals, thanks to its no-code approach and live preview. From my in-depth analysis, it’s different because you don’t need design skills or technical workarounds—your visuals just work, every time.
In this review, I’ll walk you through how Datawrapper helps you publish presentation-ready charts and maps that actually match your data stories.
You’ll see in this Datawrapper review how it stacks up—from effortless chart creation and branding, to pricing details and alternatives for your selection checklist.
By the end, you’ll know the features you need to confidently decide if this is your best pick.
Let’s get started.
Quick Summary
- Datawrapper is a web-based tool that helps you create interactive charts, maps, and tables without coding.
- Best for journalists, researchers, and teams needing quick, clear data visualizations for web or reports.
- You’ll appreciate its simple, no-code interface combined with responsive, publish-ready visuals and embed options.
- Datawrapper offers a generous free plan plus paid tiers with branding control; no free trial for paid plans.
Datawrapper Overview
Datawrapper has helped people create clean, effective data visualizations since its founding in 2011. Based in Berlin, Germany, their core mission is making charts and maps remarkably simple for non-coders.
They primarily serve newsrooms, research institutions, and corporate communications teams. What I find unique is their unwavering focus for journalists and content creators who need publish-ready graphics without having to rely on a data scientist or developer.
I’ve noticed their recent focus on stronger team collaboration features and a practical PowerPoint add-in. As you’ll see through this Datawrapper review, these are smart updates that directly support content workflows.
Unlike complex BI tools such as Tableau, Datawrapper isn’t for deep data exploration. Its entire approach thoughtfully prioritizes clarity over analytical complexity, making it ideal for telling a trustworthy story with your data.
You’ll find their charts and maps used by major news organizations, prominent think tanks, and government agencies that must communicate complex information to the public with absolute clarity and professionalism.
Their strategy feels laser-focused on accessibility and speed for your whole team. I believe this responds directly to the need for subject-matter experts to create professional visualizations themselves without waiting on anyone.
Now let’s examine their capabilities.
Datawrapper Features
Tired of complex data visualization tools?
Datawrapper features are all about making powerful data visualization accessible to everyone, no coding required. Here are the five main Datawrapper features that streamline your visual reporting.
1. Interactive Charts
Struggling to make your data truly engaging?
Static charts often fail to convey the full story, leaving your audience disengaged. This means your insights might not land as effectively as they should.
Datawrapper offers a vast array of interactive chart types that automatically adapt to any screen size. I found that creating responsive bar, line, and scatter charts felt incredibly intuitive, even with complex datasets. This feature truly brings your numbers to life for any viewer.
This means you can easily create impactful visuals that truly resonate, ensuring your message is seen and understood on any device.
- 🎯 Bonus Resource: While we’re discussing complex visuals and projects, you might find my analysis of image recognition software helpful.
2. Geographical Maps
Need to visualize data on a map, but don’t know where to start?
Creating custom maps can be incredibly complex and time-consuming, especially without specialized mapping software. This often leads to generic visuals that lack specific insights.
Datawrapper provides an extensive library of interactive maps, from global to highly specific regional views. From my testing, the choropleth and symbol map options are excellent for visualizing demographic or event-specific data. This feature lets you easily upload custom maps too.
So you can pinpoint data geographically, giving your audience a clear spatial understanding of your information.
3. Responsive Data Tables
Is presenting detailed data always a disorganized mess?
Traditional data tables are often clunky and hard to navigate, making it difficult for users to find specific information. This can frustrate your readers when they need to drill down into the numbers.
Datawrapper allows you to build interactive, responsive data tables with search, pagination, and even embedded mini-charts. What I love about this approach is how you can highlight key trends directly within the table, making dense information digestible. This feature makes raw data explorable.
This means your audience can efficiently sort through complex datasets, empowering them to discover the exact information they need without getting overwhelmed.
4. Customization and Branding
Does your brand identity get lost in your data visualizations?
Inconsistent branding across your reports can undermine professionalism and dilute your corporate identity. This makes your presentations feel less cohesive and polished.
Datawrapper provides extensive customization options to align every visual with your brand guidelines. You can easily adjust fonts, colors, and add your logos, ensuring consistency. This is where Datawrapper shines for maintaining a professional and unified look.
This means every chart and map you publish will instantly feel like an integral part of your brand, reinforcing your professional image effortlessly.
5. Collaboration and Integration
Is team collaboration on visuals a constant back-and-forth?
Sharing and revising data visualizations can be inefficient, leading to version control issues and delays. This slows down critical projects, especially in fast-paced environments.
Datawrapper supports live collaboration, edit history, and comments, simplifying teamwork on complex visuals. The free PowerPoint add-in is a game-changer, allowing you to embed and edit visualizations directly with real-time updates. This feature streamlines your workflow.
This means your team can work together seamlessly, and you can keep your presentations up-to-date without ever leaving PowerPoint.
Pros & Cons
- ✅ Incredibly intuitive, no-code interface for quick visualization creation.
- ✅ Visualizations are fully interactive and automatically responsive for all devices.
- ✅ Extensive library of chart and map types, including custom map uploads.
- ⚠️ Lacks advanced data analysis or statistical modeling capabilities.
- ⚠️ Limited deep interactivity like drill-downs or dynamic dashboards.
- ⚠️ No direct integration with SQL databases or data warehouses.
You’ll actually find that these Datawrapper features work together to create a robust, user-friendly visualization toolkit that simplifies sharing complex information.
Datawrapper Pricing
Unsure about data visualization tool pricing?
Datawrapper pricing is refreshingly clear with distinct tiers, including a powerful free plan, making it easy to understand your potential investment.
| Plan | Price & Features |
|---|---|
| Free | $0 per month • Unlimited charts, tables, maps • PNG exports • “Created with Datawrapper” attribution • Full core functionality |
| Custom | $599 per month or $5,990 per year • Full design customization • Remove Datawrapper attribution • PNG, SVG, PDF exports • 10 user licenses ($21/additional user/month) |
| Enterprise | Custom pricing – contact sales • All Custom Plan features • Self-hosting options • Single Sign-On (SSO) • Service-Level Agreements (SLAs) |
1. Value Assessment
Excellent value across plans.
From my cost analysis, what impressed me is how Datawrapper’s Free plan is genuinely robust, offering unlimited visualizations for personal use without a time limit. For professional teams, the Custom plan provides essential branding control and advanced export options, scaling predictably with user licenses.
This means your budget aligns with actual usage, letting you start free and upgrade only when advanced features are needed.
- 🎯 Bonus Resource: While we’re discussing design choices, understanding best vector graphics software is equally important.
2. Trial/Demo Options
Smart evaluation options available.
While Datawrapper doesn’t offer a traditional free trial for paid tiers, their comprehensive Free plan serves as an excellent way for you to experience core functionalities. What I found valuable is how the free plan lets you publish unlimited visualizations to truly test the tool’s capabilities before committing.
This allows you to evaluate its fit for your workflow and team, reducing financial risk before full pricing commitment.
3. Plan Comparison
Choosing the right plan matters.
The Free plan is perfect for individuals or small teams prioritizing basic visualization and public sharing, while the Custom plan serves professional needs for branding and team collaboration. What stands out is how the Enterprise tier caters to large organizations needing advanced security features and custom infrastructure.
This tiered approach helps you match Datawrapper pricing to actual usage requirements, ensuring you pay for what you truly need.
My Take: Datawrapper’s pricing strategy offers exceptional value, especially with its feature-rich free tier, making it accessible for everyone from individual users to large enterprises seeking professional data visualization.
The overall Datawrapper pricing reflects transparent value for diverse data visualization needs.
Datawrapper Reviews
What do real customers actually think?
To help you decide, I’ve analyzed numerous Datawrapper reviews, providing balanced insights into what actual users experience with this visualization tool.
1. Overall User Satisfaction
Users seem highly satisfied with Datawrapper.
From my review analysis, Datawrapper consistently receives high marks, primarily for its intuitive design and efficiency. What I found in user feedback is that its no-code approach is universally appreciated, making professional visualizations accessible without technical expertise. Many reviews mention significant time savings.
This suggests you can expect a smooth, productive experience, even if you’re new to data visualization.
2. Common Praise Points
Its simplicity constantly earns high praise.
Users frequently laud Datawrapper’s straightforward four-step process for creating charts and maps. What stood out in customer feedback is how the interactive and responsive design ensures broad device compatibility, making published visuals look great everywhere. Review-wise, the variety of visualization types also gets strong positive mentions.
This means your visualizations will not only be easy to create but also look professional and perform well.
- 🎯 Bonus Resource: If you’re also looking into industrial solutions, my article on best valve manufacturing software covers key considerations.
3. Frequent Complaints
Some users desire more advanced features.
While generally positive, frequent complaints revolve around Datawrapper’s focus on visualization over deeper analytics. What stands out in reviews is how the lack of native database integration or built-in automation is a common point of contention for advanced users. Some miss drill-downs and real-time filtering found in other tools.
These limitations aren’t deal-breakers for its core use case but are important if you need complex data analysis features.
What Customers Say
- Positive: “The ease of use is incredible; I can make professional charts in minutes without any coding.” (Journalist)
- Constructive: “Great for quick charts, but I wish it had more robust data analysis capabilities.” (Data Analyst)
- Bottom Line: “Perfect for quick, visually appealing data stories; a real time-saver for media professionals.” (Co-founder)
The overall Datawrapper reviews reflect a strong sentiment for its simplicity and efficiency, though some desire more advanced integration.
Best Datawrapper Alternatives
Too many data visualization options?
The best Datawrapper alternatives include several strong options, each better suited for different business situations, data complexity, and budget considerations you might have.
- 🎯 Bonus Resource: Speaking of boosting sales, my guide on outbound call center software explores additional strategies.
1. Tableau
Need advanced analytical power and complex dashboards?
Tableau makes more sense when your data visualization needs extend to deep analytical exploration, real-time dashboards, and handling very large, diverse datasets. What I found comparing options is that Tableau offers far more advanced data analysis capabilities, though it’s generally more expensive and has a steeper learning curve than Datawrapper.
Choose Tableau if your requirements involve complex data modeling and enterprise-level business intelligence.
2. Microsoft Power BI
Heavily invested in the Microsoft ecosystem?
Power BI works best if your organization already uses Microsoft products and requires robust business intelligence features with extensive data modeling. From my competitive analysis, Power BI provides comprehensive BI features with strong Microsoft integration, making it a cost-effective choice within that environment, unlike Datawrapper’s standalone focus.
Opt for Power BI when complex interactive dashboards and Microsoft ecosystem synergy are your top priorities.
3. Flourish
Want more creative, animated, or storytelling visuals?
Flourish is a better alternative if you prioritize visually dynamic, animated charts and interactive presentations with a modern aesthetic. From my analysis, Flourish offers a wider array of creative chart types, often providing more engaging visual narratives compared to Datawrapper’s more conservative newsroom-friendly designs.
Choose Flourish when you need unique animations and compelling interactive stories over pure data clarity.
4. Infogram
Primary need is visually rich infographics and marketing visuals?
Infogram is a strong alternative if your goal is to create comprehensive infographics, marketing reports, or social media visuals that emphasize design. Alternative-wise, Infogram offers extensive infographic templates and a broader library of design elements, providing more creative freedom for visually striking content than Datawrapper.
Infogram is a better fit when design-heavy marketing visuals and interactive elements are paramount for your content.
Quick Decision Guide
- Choose Datawrapper: Simple, clean charts for journalistic or content embedding
- Choose Tableau: Deep analytics and complex, interactive enterprise dashboards
- Choose Power BI: Comprehensive BI within the Microsoft ecosystem
- Choose Flourish: Creative, animated visualizations for storytelling
- Choose Infogram: Visually rich infographics and marketing content
Ultimately, the best Datawrapper alternatives depend on your specific business scenario and visualization goals rather than just feature lists alone.
Datawrapper Setup
How complex is Datawrapper implementation?
This Datawrapper review section analyzes what it takes to deploy and adopt the software. From my implementation analysis, Datawrapper offers a remarkably straightforward setup process.
1. Setup Complexity & Timeline
Getting started is refreshingly simple.
Datawrapper’s web-based, no-code nature means you’re largely uploading data directly or pasting it; there’s no software installation required. What I found about deployment is that you can begin creating visualizations almost instantly once you have your data ready, making it highly accessible for rapid prototyping.
- 🎯 Bonus Resource: If you’re also looking for ways to streamline administrative tasks, my guide on best child care software can help.
You’ll primarily need to plan for data preparation and understanding your visualization goals, not complex IT projects.
2. Technical Requirements & Integration
Minimal technical hurdles for your team.
Your technical requirements are basic: a device with internet access, as Datawrapper is fully web-based and embeds via <iframe> tags. From my implementation analysis, this largely eliminates infrastructure concerns that plague other data visualization tools requiring server installations or specialized hardware.
Plan for simple embed code management and potential API integration for advanced, automated workflows.
3. Training & Change Management
User adoption is remarkably intuitive.
The learning curve for Datawrapper is low, driven by its intuitive drag-and-drop editor and a clear four-step process for creating visualizations. What I found about deployment is that non-technical users quickly become proficient, reducing the need for extensive training programs and minimizing adoption resistance.
You’ll want to focus on data literacy and best practices for visualization design rather than complex software navigation training.
4. Support & Success Factors
Vendor support fosters rapid success.
Datawrapper provides robust online support through its Academy, FAQs, and blog, complemented by email support for specific queries during your implementation. From my analysis, this self-service support model empowers users to troubleshoot common issues and accelerates independent problem-solving.
Expect to leverage Datawrapper’s extensive documentation and direct support to maximize your team’s efficiency and success.
Implementation Checklist
- Timeline: Days to weeks for initial setup and proficiency
- Team Size: Data analysts, content creators, and marketing staff
- Budget: Primarily software subscription, minimal IT costs
- Technical: Web browser access and basic embed capabilities
- Success Factor: Clear data and visualization goals for your projects
Overall, the Datawrapper setup emphasizes simplicity and quick user adoption, allowing businesses to generate professional visualizations without significant technical overhead.
Bottom Line
Datawrapper: Your Data Visualization Solution?
My Datawrapper review synthesizes a powerful, intuitive tool. It’s built for rapid, professional data visualization, especially for storytelling, but consider its analytical limitations.
1. Who This Works Best For
Journalists, researchers, and content creators thrive here.
Datawrapper is ideal for individuals and teams needing to transform raw data into clear, interactive charts, maps, and tables for web embedding. What I found about target users is that anyone prioritizing clear data communication over deep analytical exploration will find it incredibly valuable, especially those in media or academic roles.
Your team will find success quickly if your goal is efficient, publish-ready visuals without requiring extensive technical skills.
2. Overall Strengths
Unmatched ease of use and responsive design.
The software excels at producing professional, interactive visualizations with a no-code approach, ensuring responsiveness across all devices. From my comprehensive analysis, its intuitive four-step workflow simplifies creation significantly, enabling non-technical users to generate publish-ready graphics rapidly and efficiently.
These strengths mean your team saves time, enhances data storytelling, and improves accessibility for your audience.
- 🎯 Bonus Resource: While focusing on visual communication, the underlying processes of any business can be optimized. If you’re looking into improving operations, my guide on best printing & packaging industry software covers key solutions.
3. Key Limitations
Lacks advanced data analysis capabilities.
While superb for visualization, Datawrapper doesn’t offer features like pivot tables, statistical modeling, or direct SQL database integration. Based on this review, you won’t find real-time filtering or drill-down interactivity, which are common in more complex BI tools or platforms like Tableau.
These limitations are significant if your primary need is deep analytical exploration or building highly customized, multi-layered dashboards.
4. Final Recommendation
Datawrapper comes highly recommended for specific needs.
You should choose this software if your primary goal is to create individual, high-quality, interactive charts, maps, or tables for web embedding or static export. From my analysis, this solution works best when ease of use and a clean design are prioritized over advanced analytical features or complex, integrated dashboards.
My confidence level is high if your focus is compelling data communication for broad audiences rather than in-depth analysis.
Bottom Line
- Verdict: Recommended for straightforward, interactive data visualization
- Best For: Journalists, researchers, and content creators needing quick, clear visuals
- Business Size: Small to mid-market teams, and large enterprises focused on communication
- Biggest Strength: Exceptional ease of use for creating professional, embeddable charts
- Main Concern: Absence of advanced data analysis and complex dashboard features
- Next Step: Try the free plan to assess its fit for your visualization projects
This Datawrapper review shows strong value for the right business profile, particularly if your goal is clear, compelling, and accessible data communication.


