Reporting chaos slowing your marketing down?
If you’re evaluating marketing analytics tools, you probably want to fix the headaches of wrangling multiple platforms and endless manual reports just to get clear, client-ready updates.
The daily reality? You’re wasting hours pulling scattered data from all over, and that means less time for actual campaign work and results.
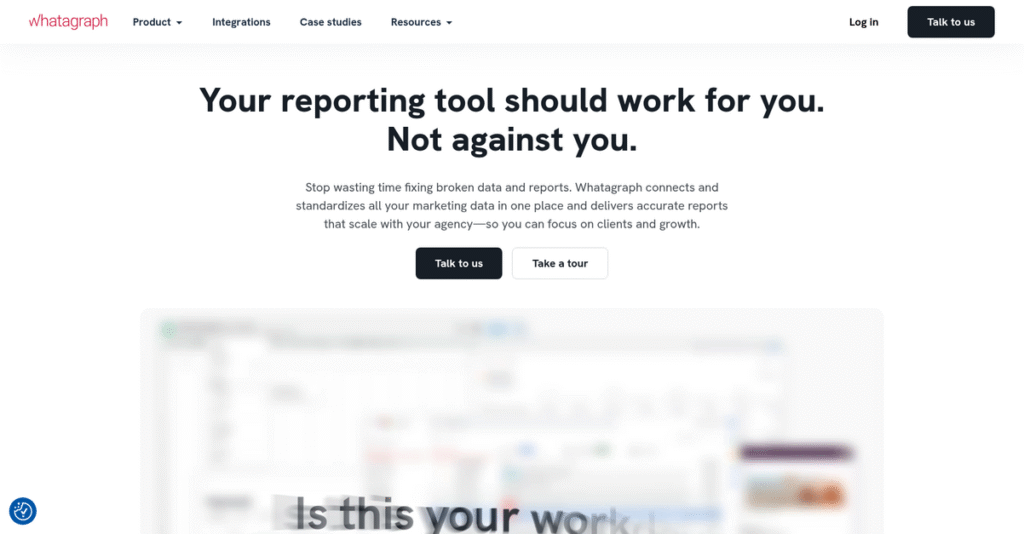
Whatagraph promises a different approach—automating multi-channel data collection, blending reports, and delivering interactive dashboards branded for your team or clients, all without clunky manual processes. After digging through its features, pricing, and user feedback, I’ve got hands-on insights that separate their strengths from typical reporting tools.
In this comprehensive review, I’ll show you how Whatagraph actually simplifies your reporting process so you can focus on marketing impact, not admin work.
Here’s what you get in this Whatagraph review: a breakdown of their dashboard builder, templates, automation, cross-channel features, pricing, and how they stack up against other tools you’re considering.
You’ll come away knowing what features you need to make a confident decision—no surprises, no fluff.
Let’s dive right in.
Quick Summary
- Whatagraph is a marketing reporting tool that automates data collection and creates visually clear marketing performance reports.
- Best for digital marketers and agencies needing quick, client-ready marketing reports across multiple channels.
- You’ll appreciate its intuitive drag-and-drop interface and strong automation that saves your team hours on manual reporting work.
- Whatagraph offers tiered pricing plans with a 7-day free trial, though full details require contacting sales for custom quotes.
Whatagraph Overview
Whatagraph aims to simplify marketing analytics and reporting for agencies and brands. Based in Lithuania, they’ve been focused on this clear mission since their founding back in 2015.
What sets them apart is their focus on marketing agencies and in-house teams who need automated reports without deep technical skills. They are built for non-technical marketing professionals who value clarity and efficiency.
- 🎯 Bonus Resource: If you’re managing various aspects of your campaigns, you might find my guide on best email marketing software helpful.
Their recent push into AI-powered text generation and predictive analytics is a smart move. I’ll show you the practical impact of this through this Whatagraph review.
Unlike complex BI tools like Looker Studio or pure data-movers like Supermetrics, Whatagraph’s value is its balance. They focus on blending powerful reporting with visual simplicity, which feels much more approachable.
They work with thousands of digital marketing agencies and mid-sized businesses that need to prove campaign ROI to clients and stakeholders without getting lost in endless spreadsheets.
From my analysis, their current strategic focus is on delivering a unified, cross-channel view of performance that is automated and client-ready. This addresses your need for professional reporting efficiency.
Now let’s examine their core capabilities.
Whatagraph Features
Tired of endless manual marketing reports?
Whatagraph features are designed to automate and simplify marketing reporting. Here are the five main Whatagraph features that help you get a clear view of your marketing performance.
1. Automated Data Collection
Still wasting hours on manual data entry?
Copy-pasting marketing data from various sources can be a real drain on your time. This often leads to errors and outdated insights.
Whatagraph automatically pulls data from over 50 marketing platforms, centralizing all your performance metrics without you lifting a finger. What I love is how seamlessly it integrates with everything from social media to Google Analytics. This feature truly frees up your team from tedious data gathering.
This means you can finally ditch the spreadsheets and focus on analyzing insights, not just collecting data.
- 🎯 Bonus Resource: Before diving deeper, understanding how to secure compliance is key. My analysis of best waiver software covers this vital area.
2. Customizable Reports and Dashboards
Struggling to make your reports visually appealing?
Generic, unbranded reports can fail to impress clients and stakeholders. Presenting complex data clearly is a constant challenge.
Whatagraph offers over 100 marketing-specific templates and a drag-and-drop interface to build visually engaging, branded reports. From my testing, personalizing reports with your logo and colors is incredibly straightforward. This feature transforms raw data into easy-to-understand infographic-style visuals.
So you can deliver professional, client-ready reports that actually make an impact and solidify your brand.
3. Data Blending and Cross-Channel Reporting
Can’t get a unified view of your marketing efforts?
Siloed data from different channels makes it hard to see the holistic impact of your campaigns. This prevents truly informed decision-making.
Whatagraph excels at blending data from multiple sources into unified cross-channel reports, even combining metrics from different campaigns. This is where Whatagraph shines: you get a single, comprehensive overview of all your marketing performance. This feature provides the big picture needed for strategic planning.
This means you can connect the dots between channels and make data-driven decisions based on a complete understanding of your efforts.
4. Automated Report Delivery
Is sending reports a consistent headache?
Manually sending reports, especially to multiple clients or stakeholders, is time-consuming and prone to human error. Consistency becomes a struggle.
Whatagraph automates report delivery via email or live links, complete with white-labeling for a professional touch. The white-labeling capability ensures a consistent client experience with your own branding. This feature ensures your clients receive branded, client-ready reports exactly when they expect them.
The result is streamlined communication, ensuring your stakeholders get timely updates without any manual effort on your part.
5. Real-Time Data Syncing and Predictive Analytics
Working with outdated campaign performance numbers?
Stale data can lead to reactive decisions rather than proactive strategy. You need current insights to optimize effectively.
Whatagraph provides real-time data syncing to ensure your metrics are always up-to-date for accurate performance tracking. What I found impressive is their highly rated predictive analytics features. This feature empowers you to forecast trends and proactively optimize your marketing strategies.
This means you can monitor campaigns with current data, identify opportunities, and make adjustments that genuinely improve your ROI.
Pros & Cons
- ✅ Excellent automated data collection from many marketing platforms.
- ✅ Highly intuitive drag-and-drop report builder with many templates.
- ✅ Superior data blending for truly unified cross-channel reporting.
- ⚠️ Some limitations in design customization compared to advanced tools.
- ⚠️ Niche integration requests or “buggy” experiences reported by users.
- ⚠️ Pricing can be a concern, especially for smaller businesses or solo users.
These Whatagraph features work together to create a powerful marketing performance solution that truly simplifies data visualization and reporting for you.
Whatagraph Pricing
How much will this actually cost?
Whatagraph pricing isn’t always publicly displayed, often requiring you to contact sales for a custom quote, but they do offer flexible plans.
| Plan | Price & Features |
|---|---|
| Professional | Approximately $119/month (billed annually, for 25 data sources, 5 users) or $223/month (billed annually, minimum 5 seats) • Basic features • Unlimited reports • Tailored for medium teams • White-labeling (sometimes) |
| Premium | Approximately $279/month (billed annually, for 50 data sources, 10 users) or $335/month (billed annually) • Full feature access • Priority support • Supports more users and data sources • Recommended for large teams/agencies |
| Growth | Approximately $699/month (billed annually) • Most expensive tier • Unlimited features |
| Custom | Custom pricing – contact sales • 100+ data sources • Unlimited users • For larger agencies and enterprises • Intricate reporting requirements |
1. Value Assessment
Does their pricing offer good value?
From my cost analysis, Whatagraph’s tiered pricing, despite some variability, aims to scale with your team’s needs, offering more data sources and users as you move up. What stood out is how their pricing structure targets different business sizes, helping you find a plan that fits without immediate overcommitment.
- 🎯 Bonus Resource: Speaking of marketing efforts, check out my guide on best influencer marketing software for accelerating growth.
This means your budget can align with actual usage, letting you expand features as your reporting requirements grow.
2. Trial/Demo Options
Try before you buy, sort of.
Whatagraph offers a seven-day free trial, allowing you to test the platform’s features and understand its reporting capabilities firsthand. However, I found some conflicting information, with other sources suggesting you may need to purchase a plan. Their trial offers a crucial test period for you to evaluate the interface and automation.
This lets you assess the reporting value before committing to any of the Whatagraph pricing plans.
3. Plan Comparison
Which plan is right for your budget?
The Professional plan is a solid starting point for medium teams, while the Premium tier offers substantial upgrades in data sources and users. The Growth plan is designed for those needing unlimited features, while Custom is for large-scale, complex needs. What I found regarding pricing is that each tier adds significant value for specific user and data volumes.
This helps you match Whatagraph pricing to actual usage requirements, ensuring your budget gets the right fit.
My Take: Whatagraph’s pricing strategy caters to a range of business sizes, from medium teams to large enterprises, offering scaled features that justify the investment for automated reporting.
The overall Whatagraph pricing reflects scaled value for diverse reporting needs.
Whatagraph Reviews
What do real customers actually think?
These Whatagraph reviews provide an analytical look at what users genuinely experience. I’ve gathered insights from various platforms to give you a balanced perspective on its real-world performance.
1. Overall User Satisfaction
Users largely feel positive.
From my review analysis, Whatagraph consistently earns high ratings, typically ranging from 3.8 to 4.5 stars across platforms like G2 and Capterra. What I found in user feedback is how most customers find it an effective reporting tool, often highlighting its ability to simplify complex data tasks, making it a valuable asset for them.
This suggests you can expect a generally positive and efficient experience.
- 🎯 Bonus Resource: If you’re also looking into effective strategies, my article on WhatsApp marketing software covers how to boost engagement.
2. Common Praise Points
Its ease of use is a standout.
Users consistently praise Whatagraph’s intuitive design, drag-and-drop functionality, and pre-built templates, which greatly simplify report creation. What stood out in customer feedback is how it dramatically reduces time spent on reporting, allowing users to focus more on insights rather than data compilation.
This means you’ll likely save significant time in your weekly and monthly reporting cycles.
3. Frequent Complaints
Some limitations do exist.
While customization is a strength, some reviews point out limited design options for visuals compared to more advanced tools. What stands out in feedback is how users desire more freedom in widget design and broader integration options, particularly for niche marketing tools.
These complaints seem like minor annoyances rather than deal-breakers for most users.
What Customers Say
- Positive: “Setting it up takes minutes, and the reports are intuitive.” (User Review)
- Constructive: “Not enough freedom in the size and design of widgets.” (User Review)
- Bottom Line: “Has easily reduced the amount of time we spend on reports each week and month.” (User Review)
The overall Whatagraph reviews reflect genuine satisfaction, particularly with its time-saving capabilities and ease of use.
Best Whatagraph Alternatives
Need to find the perfect reporting tool?
The best Whatagraph alternatives include several strong options, each better suited for different business situations, technical expertise, and budget priorities.
1. Supermetrics
Your data integration needs are extensive.
Supermetrics excels if you require powerful data aggregation from over 100 sources, giving you full control to move data into various external analytical tools. From my competitive analysis, Supermetrics offers extensive data source and destination flexibility for advanced transformations, which Whatagraph doesn’t provide.
Choose Supermetrics when you need granular data access and robust data integration capabilities for complex analysis.
2. Looker Studio
You have strong technical skills and need customization.
Looker Studio (formerly Google Data Studio) is ideal if you’re comfortable with a steeper learning curve but want highly customizable, visually advanced dashboards. What I found comparing options is that Looker Studio offers vast data source connections at no cost, making it a compelling free alternative.
Consider this alternative when custom visualization and broad, free data connections outweigh Whatagraph’s ease of use and support.
3. AgencyAnalytics
You run an agency needing all-in-one SEO features.
AgencyAnalytics makes more sense if you’re a marketing agency or freelancer looking for an all-in-one solution with integrated SEO tools, rank tracking, and extensive white-labeling. Alternative-wise, AgencyAnalytics offers comprehensive agency-specific features at a competitive price, unlike Whatagraph’s core focus.
Choose AgencyAnalytics when your agency requires integrated SEO tools and robust white-labeling included across plans.
4. Swydo
Prioritizing budget and quick report automation?
- 🎯 Bonus Resource: While we’re discussing report automation, understanding content curation software is equally important for boosting engagement.
Swydo is a solid option if you’re a smaller agency or prioritize a budget-friendly, straightforward solution for automating reports with quick setup. What I found comparing options is that Swydo offers unlimited users and reports at a flat fee, which can be more predictable than Whatagraph’s tiered pricing.
Consider this alternative when cost-effectiveness and rapid report deployment for a smaller agency are your top priorities.
Quick Decision Guide
- Choose Whatagraph: User-friendly, visually appealing, automated marketing reports
- Choose Supermetrics: Extensive data integration for advanced analysis
- Choose Looker Studio: Free, highly customizable for technically skilled users
- Choose AgencyAnalytics: All-in-one agency solution with SEO tools
- Choose Swydo: Budget-friendly, simple report automation for smaller agencies
The best Whatagraph alternatives depend on your specific business needs and budget rather than just feature lists.
Whatagraph Setup
Concerned about complicated software setup and training?
Whatagraph implementation is generally straightforward and user-friendly, as this Whatagraph review will explore, but setting realistic expectations is crucial for a smooth deployment.
1. Setup Complexity & Timeline
Getting started is generally quick.
Whatagraph implementation involves linking data sources and utilizing drag-and-drop report creation, which many users find intuitive. From my implementation analysis, most users find it quick to use once learned, with basic setup taking minutes for simple reporting needs.
You’ll want to plan for a slight learning curve with customization, especially when fine-tuning widget designs for specific report visuals.
2. Technical Requirements & Integration
Technical hurdles are relatively low.
Your team will find Whatagraph is cloud-based, requiring almost no coding knowledge or significant hardware investments for setup. What I found about deployment is that it’s designed to be user-friendly with low technical overhead, integrating with various marketing platforms seamlessly.
Plan for potential “buggy” experiences during initial linking or specific integration issues, which may require minor troubleshooting with support.
3. Training & Change Management
User adoption is often smooth and intuitive.
Staff training focuses on its drag-and-drop canvas and pre-built templates, which greatly streamline report creation and save time. From my analysis, its ease of use helps reduce training time significantly, allowing your team to focus on insights quickly.
Invest in familiarizing your team with customization options to fully leverage its reporting capabilities and overcome any initial “finicky” elements.
- 🎯 Bonus Resource: Speaking of learning, my guide on best language learning software can help simplify your choice.
4. Support & Success Factors
Vendor support significantly aids adoption.
Whatagraph offers extensive, highly-rated live chat and dedicated account manager support to help new users get accustomed. From my analysis, top-notch support is a critical success factor, helping mitigate initial setup issues and accelerate user proficiency with the platform.
Prepare to leverage their support resources, as prompt assistance can quickly resolve minor setup hiccups and optimize your reporting workflows.
Implementation Checklist
- Timeline: Days to weeks for basic setup; ongoing for complex customizations
- Team Size: Marketing team members; minimal IT involvement
- Budget: Primarily software cost; minimal for implementation services
- Technical: Cloud-based; requires data source authentication
- Success Factor: Leveraging pre-built templates and strong customer support
Overall, Whatagraph setup emphasizes user-friendliness and rapid deployment, making it accessible for teams looking to streamline reporting with minimal technical fuss.
Bottom Line
Who should consider Whatagraph for reporting?
This Whatagraph review offers a balanced assessment, guiding you to understand where this marketing reporting platform truly shines and for whom it provides the most value.
1. Who This Works Best For
Digital marketers and agencies needing streamlined reporting.
Whatagraph is ideal for marketing agencies managing multiple clients and in-house marketing teams who spend too much time on manual reporting. From my user analysis, businesses prioritizing visually appealing, client-ready reports will find it invaluable for enhancing client communication.
You’ll succeed if you need to consolidate cross-channel data and deliver automated, polished reports to non-technical stakeholders.
2. Overall Strengths
Visual clarity and reporting automation are exceptional.
The software excels at transforming complex marketing data into easy-to-understand, infographic-style visuals and automating report delivery. From my comprehensive analysis, its intuitive drag-and-drop interface significantly streamlines report creation, freeing your team to focus on insights and strategy.
These strengths allow your business to deliver consistent, professional reports efficiently, elevating your marketing performance communication.
3. Key Limitations
Customization depth and pricing raise some concerns.
While strong, some users desire more granular control over report design and advanced customization beyond existing templates. Based on this review, pricing can be a significant barrier for smaller businesses, making it less accessible for solopreneurs or very lean agencies.
These limitations are important to consider, but they don’t necessarily negate its value for the right business profile and budget.
4. Final Recommendation
Whatagraph earns a strong recommendation for specific users.
You should choose Whatagraph if your priority is creating professional, automated, and visually appealing client-facing marketing reports across multiple channels. From my analysis, this solution is best for agencies and in-house teams that value time savings and clear data presentation over advanced data manipulation.
My confidence level is high for its target audience but lower for those seeking highly customizable data transformation tools.
Bottom Line
- Verdict: Recommended for agencies and marketing teams prioritizing visual reporting
- Best For: Digital marketers and agencies needing automated, client-ready reports
- Business Size: Small to medium-sized marketing agencies and in-house teams
- Biggest Strength: Automated, visually appealing, and customizable client reporting
- Main Concern: Pricing can be high for smaller businesses; some customization limits
- Next Step: Explore the free trial to assess visual reporting capabilities
This Whatagraph review demonstrates strong value for marketing agencies and teams focused on streamlined, visual reporting, while also noting crucial pricing considerations.


