Slow performance issues can wreck your day.
If you’re researching New Relic, you probably need a better way to track and fix software problems that keep your apps crawling.
But here’s the daily reality: You’re wasting valuable time chasing issues blind while users report errors, and it’s slowing down releases.
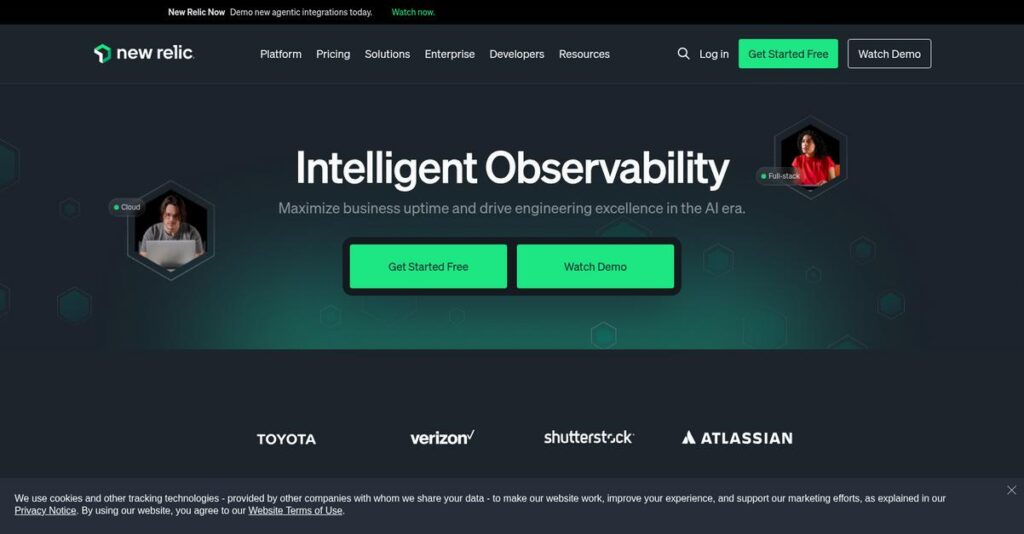
New Relic brings integrated observability tools that let you see everything in real time—across the app, infrastructure, logs, and more. Based on my deep analysis, their unified platform stands out for its full-stack monitoring, usage-based pricing, and a single pane of glass for all your data.
In this review, I’ll dive into how New Relic actually gives you control over messy troubleshooting and system health.
You’ll see how it performs across features, pricing, setup, and how it stacks up to alternatives—everything you need in this New Relic review to support your decision.
You’ll leave knowing if it has the features you need to speed up your debugging and deliver reliable apps.
Let’s get started.
Quick Summary
- New Relic is a cloud-based observability platform that provides real-time insights into application and infrastructure performance.
- Best for developers, SREs, and IT teams needing full-stack monitoring and troubleshooting across complex software environments.
- You’ll appreciate its unified data platform that consolidates metrics, logs, traces, and events for faster problem resolution.
- New Relic offers a usage-based pricing model with a free tier and paid plans scaling by data ingest and user seats.
New Relic Overview
New Relic has been a major player in the observability space since 2008. From their San Francisco HQ, their core mission is helping you monitor, debug, and improve your entire software stack.
They serve everyone from small developer teams to large enterprises. What I find unique is their commitment to a single source for all telemetry data. This really helps your engineering and ops teams finally break down those frustrating data silos.
Their 2023 acquisition by private equity was a significant shift, moving them off the public market. As we’ll explore through this New Relic review, it signals a renewed focus on long-term platform growth.
Compared to competitors like Datadog, their approach feels more straightforward. Their value proposition is built on predictable, usage-based pricing and an easier out-of-the-box APM experience, which I find very practical.
- 🎯 Bonus Resource: If you’re managing various organizational records, my article on best cemetery software explores specialized tools.
You’ll find them working with a huge range of organizations, including top names in e-commerce, media, and technology that simply can’t afford any downtime or performance lags.
From my perspective, their strategic priority is platform consolidation. They want to be your single observability tool, which aligns perfectly with the market’s desire to reduce vendor sprawl and simplify operations.
Now let’s examine their capabilities.
New Relic Features
Drowning in a sea of disconnected monitoring alerts?
New Relic features provide a unified observability platform designed to give engineers full-stack visibility. These are the five core New Relic solutions that solve critical performance and stability challenges.
1. Application Performance Monitoring (APM)
Struggling to pinpoint application bottlenecks?
Slow application response times directly impact user experience and can cost you customers. This often leads to frustrating, time-consuming debugging sessions.
New Relic APM offers deep insights into your application’s health, helping you quickly identify and resolve performance issues. From my testing, its ability to trace transactions down to specific lines of code is incredibly powerful for accelerating troubleshooting and reducing downtime.
This means you can proactively address performance problems, ensuring your applications run smoothly and efficiently for your users.
2. Infrastructure Monitoring
Unsure how infrastructure issues impact your apps?
Blind spots in your infrastructure can hide the root cause of application slowness. This makes scaling resources or diagnosing outages a guessing game.
New Relic Infrastructure provides real-time visibility into your servers, containers, and databases, linking their performance directly to your applications. What I love about this feature is how it helps you understand the direct impact of infrastructure on application performance, allowing for smarter resource allocation.
The result is your team gains clear insights into system health, enabling effective scaling and quicker issue resolution across your entire environment.
- 🎯 Bonus Resource: While we’re discussing performance and efficiency, my article on sports league software covers solutions for seamless operations.
3. Log Management
Wading through endless log files for answers?
Scattered log data makes troubleshooting a nightmare, prolonging outages and increasing mean time to resolution. You need contextual information, fast.
New Relic Logs centralizes all your log data, making it searchable, analyzable, and visual. Here’s what I found: correlating logs with APM errors and traces provides full contextual information for faster problem-solving, which is a huge time-saver when you’re in a bind.
This means you can swiftly diagnose issues by seeing logs in context with other telemetry, turning log chaos into actionable intelligence.
4. Browser Monitoring (Real User Monitoring – RUM)
Do your users face frustratingly slow web experiences?
Poor website performance directly impacts user satisfaction and conversion rates. You need to understand real user interactions to optimize.
New Relic Browser tracks how real users experience your website, providing insights into page load times, JavaScript errors, and Web Vitals. This is where New Relic shines; it helps you optimize web experiences across different devices and geographies by seeing exactly what your users are seeing and experiencing.
So, as a developer, you can proactively improve user journeys and detect errors before they impact a wide audience, ensuring a smoother browsing experience.
5. Synthetics Monitoring
Waiting for customers to report website outages?
Reactive monitoring means you’re always behind, potentially losing business when your site goes down. You need to catch problems before users do.
New Relic Synthetics proactively simulates user behavior on your websites and APIs from various global locations. This feature helps you catch problems like slow load times or failures before any actual customers experience them, using scripted tests for critical transactions.
This means you can ensure continuous availability and performance, giving you peace of mind that your digital services are always running as expected.
Pros & Cons
- ✅ Provides deep, real-time insights into application performance and health.
- ✅ Unified platform gathers all telemetry data to eliminate data silos.
- ✅ Customizable dashboards aid effective root cause analysis.
- ⚠️ Pricing can become complex and expensive as data and users scale.
- ⚠️ Utilizing full capabilities requires a significant learning curve.
- ⚠️ Alerting features sometimes lack advanced customization options.
You’ll actually appreciate how these New Relic features work together, providing a unified view across your entire stack to pinpoint issues quickly and efficiently.
New Relic Pricing
Worried about hidden software costs?
New Relic pricing offers a usage-based model with transparent tiers, making it easier for you to understand costs based on data ingest and user types.
| Plan | Price & Features |
|---|---|
| Free Tier | Perpetual free access • 100 GB data ingest/month • 1 free full platform user • Unlimited basic/core users • Over 30 observability capabilities |
| Standard Tier | $10 for first full user, $99 for additional (up to 5) • $49/month for core users • $0.35/GB after 100 GB • Ticketed support (2-day SLA) • SAML single sign-on |
| Pro Tier | $349/full user (annual), $418.80/full user (monthly) • $49/month for core users • $0.35/GB after 100 GB • Priority support • Advanced features |
| Enterprise Tier | Custom pricing – contact sales • Tailored for large organizations • Advanced security • Bespoke solutions • Priority support |
1. Value Assessment
Understand the real value.
From my cost analysis, New Relic’s tiered approach means you only pay for the observability capacity you truly need. The usage-based pricing aligns directly with your growth, helping you avoid oversized plans that strain your budget from the start.
This means your monthly costs stay predictable, allowing your finance team to budget with confidence.
- 🎯 Bonus Resource: While discussing data and costs, my guide on event tracking software can help unlock data and boost revenue.
2. Trial/Demo Options
Evaluate before you commit.
New Relic offers a generous perpetual Free Tier, including 100 GB of data ingest and one full platform user, allowing extensive evaluation. What I found invaluable is how you can truly explore its 30+ capabilities without needing a credit card to get started, reducing your commitment risk.
This lets you validate the platform’s fit for your operations before spending money on a paid tier.
3. Plan Comparison
Choose your perfect fit.
The Free tier is great for individuals, but the Standard and Pro tiers offer escalating features and support for growing teams. What stands out is how data ingest costs are consistent across paid tiers, letting you scale data without sudden surprises.
This tiered approach helps you match New Relic pricing to your actual usage requirements rather than overpaying for unused features.
My Take: New Relic’s pricing structure prioritizes flexibility and scalability based on usage, making it a strong choice for businesses of all sizes who want predictable costs and avoid vendor lock-in.
The overall New Relic pricing reflects predictable value for your operational needs.
New Relic Reviews
What do real customers actually think?
This customer reviews section analyzes real user feedback and experiences to help you understand what actual customers think about the software, focusing on New Relic reviews.
1. Overall User Satisfaction
Users seem quite satisfied overall.
- 🎯 Bonus Resource: Speaking of data and systems, if you’re exploring educational platforms, my guide on best student information system covers more.
From my review analysis, New Relic generally receives positive feedback, with a strong average user satisfaction. What I found in user feedback is how users often praise its intuitive interface and powerful capabilities for monitoring, making it a reliable tool.
This suggests you can expect a positive experience, especially for core monitoring needs.
2. Common Praise Points
Real-time insights are a consistent favorite.
Users frequently highlight New Relic’s deep insights into application performance and real-time monitoring. From the reviews I analyzed, the customizable dashboards aid root cause analysis, allowing users to pinpoint issues quickly and efficiently, which is invaluable.
This means you’ll gain critical visibility to troubleshoot and optimize your applications effectively.
3. Frequent Complaints
Pricing at scale is a common concern.
A recurring issue in customer feedback is the pricing complexity, especially its cost as workloads and user seats scale. What stands out is how user-based and data ingestion costs add up, potentially becoming very expensive for large organizations with many teams.
These challenges imply you should carefully assess your potential usage and budget needs.
What Customers Say
- Positive: “My experience with New Relic has been very positive. It provides deep insights into application performance.” (User Review)
- Constructive: “New Relic charges based on data ingestion and user seats. Many users find it costly and complex.” (User Review)
- Bottom Line: “Creating customizable dashboards to see what I need to see is great. Viewing problems and seeing the impact… is a great help.” (User Review)
The overall New Relic reviews show strong performance balanced by pricing considerations, particularly for larger scale.
Best New Relic Alternatives
Finding the right observability solution?
The best New Relic alternatives include several strong options, each better suited for different business situations, budget considerations, and specific technical requirements.
1. Datadog
Need deep cloud and infrastructure integration?
Datadog excels as an all-in-one platform with robust API and extensive third-party integrations, particularly in complex multi-cloud environments. From my competitive analysis, Datadog offers comprehensive cloud infrastructure monitoring, often surpassing New Relic’s focus on APM, though its pricing can be less transparent.
Choose Datadog if your primary need is extensive cloud monitoring and deep infrastructure visibility.
2. Dynatrace
Seeking automated, AI-powered enterprise insights?
Dynatrace is an enterprise-grade observability solution known for its AI engine, Davis, which automates problem detection and root cause analysis. What I found comparing options is that Dynatrace provides more automated, granular insights than New Relic for complex, large-scale cloud-native deployments.
Consider this alternative for large enterprises requiring deep visibility and automated AI-driven analytics.
3. Prometheus + Grafana
Preferring open-source control and customization?
Prometheus + Grafana is a powerful open-source combination for metrics collection and visualization, popular in cloud-native and Kubernetes environments. Alternative-wise, this pairing offers complete control and customization over your monitoring stack at a lower upfront cost than New Relic.
Choose this duo if your team prioritizes open-source solutions and desires full control over their stack.
4. Elastic Observability (ELK Stack)
Already using Elasticsearch for logging needs?
Elastic Observability provides an open-core solution for integrated logs, metrics, and traces with strong search capabilities powered by Elasticsearch. What I found comparing options is that Elastic excels in customizable log management if you value data ownership and fine-grained control over your monitoring solution.
Choose this alternative if you prefer an open-source foundation with high flexibility for log-centric needs.
Quick Decision Guide
- Choose New Relic: Unified, user-friendly full-stack observability with predictable pricing
- Choose Datadog: Comprehensive cloud monitoring and extensive integrations
- Choose Dynatrace: Enterprise-grade, AI-powered automated insights for complex environments
- Choose Prometheus + Grafana: Open-source control and deep customization for cloud-native setups
- Choose Elastic Observability: Flexible, open-source logging with powerful search capabilities
The best New Relic alternatives ultimately depend on your specific business size, budget, and technical priorities, not just feature lists.
New Relic Setup
What are you signing up for?
This New Relic review section offers practical guidance on the implementation process, helping you understand the real-world deployment approach and complexity. Let’s set realistic expectations for your setup.
- 🎯 Bonus Resource: While we’re discussing setup and data, ensuring your digital assets are safe is crucial. My article on best email backup software covers essential protection strategies.
1. Setup Complexity & Timeline
Is New Relic easy to implement?
For basic monitoring, New Relic is generally straightforward. What I found about deployment is that initial setup typically takes 2-4 days, especially for getting core APM insights, as agents are relatively simple to attach. Complexity increases with advanced features like distributed tracing.
You’ll want to plan for scoping your monitoring needs to ensure your implementation aligns with your specific business goals.
2. Technical Requirements & Integration
How will it fit into your existing stack?
New Relic is cloud-based, relying on agents for various languages and integrations with major cloud providers. From my implementation analysis, it seamlessly integrates with your existing cloud infrastructure, though log management requires agents or third-party tools.
Your IT team will need to manage agent deployments and data ingestion methods to ensure comprehensive observability across your environment.
3. Training & Change Management
Will your team embrace the new tools?
While the interface is intuitive for basic use, unlocking New Relic’s full power, including NRQL and custom dashboards, requires dedicated effort. From my analysis, a steeper learning curve exists for advanced utilization, necessitating a structured training approach for your engineering and operations teams.
Invest in training on advanced features and foster internal champions to maximize data querying and visualization capabilities.
4. Support & Success Factors
What support can you expect?
New Relic offers ticketed support with varying SLAs, and users generally report positive experiences with their assistance during deployment. Setup-wise, detailed documentation aids in self-service implementation, but higher tiers provide quicker response times for critical issues.
Plan to leverage their documentation and consider higher support tiers if rapid issue resolution is crucial for your implementation success.
Implementation Checklist
- Timeline: 2-4 days for basic; weeks for full utilization
- Team Size: Development and operations teams for agent deployment
- Budget: Beyond software, account for internal training time
- Technical: Agent deployment and cloud service integrations
- Success Factor: Dedicated training on advanced features like NRQL
The overall New Relic setup emphasizes an accessible entry point, but maximizing value requires ongoing learning and strategic planning.
Bottom Line
Is New Relic the right observability solution for you?
- 🎯 Bonus Resource: If you’re also looking into optimizing business operations, my guide on best supermarket billing software explores how to unify store data for growth.
This New Relic review synthesizes key insights to help you understand where the platform excels, its limitations, and who stands to benefit most from its comprehensive features.
1. Who This Works Best For
Engineers and IT operations teams.
New Relic is ideal for developers, DevOps teams, and SREs in small to mid-sized businesses, and even larger enterprises with complex systems, needing unified observability. What I found about target users is that teams needing real-time performance insights across their stack benefit immensely from its integrated metrics, events, logs, and traces.
You’ll find exceptional value if your primary goal is to accelerate troubleshooting and optimize your entire software delivery pipeline.
2. Overall Strengths
Unified observability delivers unparalleled clarity.
The platform excels by consolidating all telemetry data into a single view, providing deep APM insights and distributed tracing for complex microservices architectures. From my comprehensive analysis, its predictable usage-based pricing model offers transparent cost management compared to per-host licensing, especially for growing teams looking to scale monitoring efforts efficiently.
These strengths translate into faster problem resolution, improved system reliability, and a clearer understanding of your application health for your business.
3. Key Limitations
Learning curve and scaling costs require careful planning.
While intuitive for basic use, fully leveraging New Relic’s advanced features can involve a steep learning curve, and costs can escalate rapidly with high data ingest volumes. Based on this review, large organizations may find user-based pricing expensive for numerous teams, impacting overall budget predictability despite usage-based advantages.
I’d say these limitations are important considerations that necessitate a thorough evaluation of your specific needs and expected usage.
4. Final Recommendation
New Relic comes highly recommended for many.
You should choose this software if you’re an engineering or operations team seeking a robust, all-in-one observability platform with strong APM capabilities. From my analysis, this solution works best for teams prioritizing comprehensive real-time insights to quickly diagnose and resolve performance issues across distributed systems and cloud infrastructure.
My confidence level is high for organizations embracing full-stack observability, provided they account for potential cost scaling.
Bottom Line
- Verdict: Recommended for comprehensive full-stack observability
- Best For: Developers, DevOps, SREs, and IT operations teams
- Business Size: Small to mid-sized businesses and scaling enterprises
- Biggest Strength: Unified platform for metrics, events, logs, and traces
- Main Concern: Potential for rapid cost scaling with high data ingest
- Next Step: Explore the free tier or request a tailored demo for your team
This New Relic review shows strong value for teams needing unified visibility while also highlighting important considerations around cost and complexity for optimal use.


