Can your data really connect the dots?
If you’re dealing with complex, scattered information across your business, finding hidden connections is next to impossible with traditional databases.
But here’s the thing—you’re constantly missing out on deep insights because it’s just too slow or complicated to analyze everything you’ve got.
TigerGraph fixes this by letting you run real-time, multi-level graph analytics on huge data sets, uncovering patterns that rigid relational databases simply can’t reveal. Their platform stands out with native parallel processing, a visual design studio, and industry-ready solution kits—all aimed at making powerful graph analytics accessible and fast.
In this review, I’ll show you how TigerGraph can transform your data analysis and actually help you surface relationships that impact your business outcomes.
You’ll discover, in this TigerGraph review, practical evaluations of key features, how the pricing works, my hands-on take on performance, plus where TigerGraph fits versus top competitors right now.
You’ll leave knowing the features you need to actually accelerate your decision—without wasting weeks in trial and error.
Let’s get started.
Quick Summary
- TigerGraph is a graph analytics platform that delivers fast, scalable real-time deep link insights on complex connected data.
- Best for organizations needing high-performance analytics on massive, highly interconnected datasets.
- You’ll appreciate its native parallel architecture that enables rapid data loading and complex multi-hop query speeds.
- TigerGraph offers custom pricing with a free cloud tier and $25 credit to explore its platform on TigerGraph Cloud.
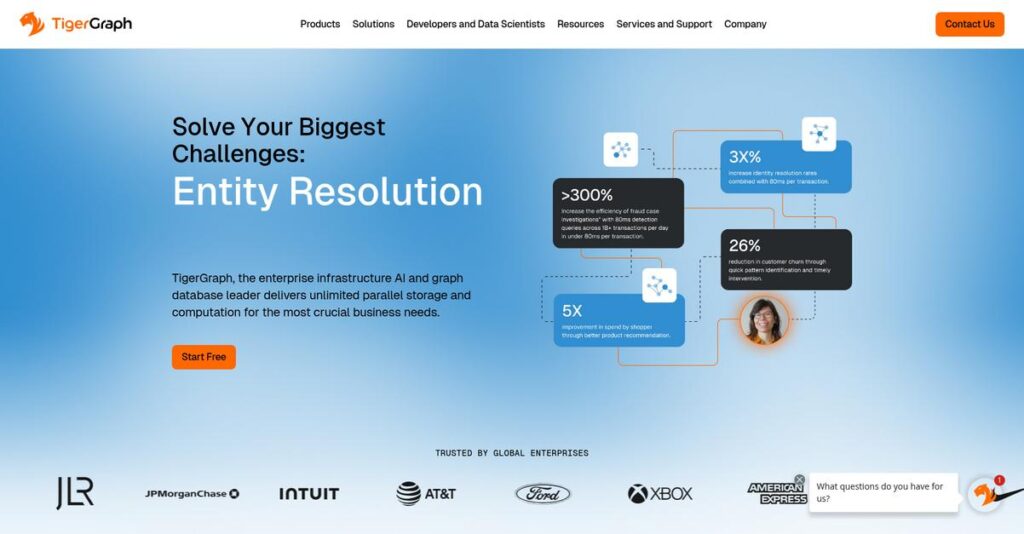
TigerGraph Overview
TigerGraph has been tackling complex graph analytics challenges since its founding in 2012. From their base in Redwood City, California, their core mission is empowering organizations with exceptionally fast and genuinely scalable data processing.
- 🎯 Bonus Resource: Speaking of empowering organizations, you might find my guide on best job evaluation software helpful for securing top talent.
From my analysis, their primary focus is on large enterprises and innovative mid-size firms with truly demanding, mission-critical workloads. They specialize in solving complex data problems, especially for critical use cases in finance and healthcare.
Through this TigerGraph review, you’ll see how their recent strategic investment and Savanna cloud platform launch underscore a clear, aggressive push towards dominating the essential enterprise-grade AI infrastructure market.
Unlike competitors like Neo4j which can struggle with scale, their key advantage is real-time deep link analytics on truly massive datasets. I find their native parallel architecture is what gives them a serious performance edge.
They work with major Fortune 500s and innovative startups, particularly in regulated industries like financial services and healthcare that must untangle incredibly complex data relationships to uncover sophisticated fraud and manage risk.
It’s clear their current strategy is all about providing a high-performance graph foundation for enterprise AI and real-time analytics. This forward-thinking approach directly aligns with your need for deeper insights from highly connected operational data.
Let’s dive into their feature set.
TigerGraph Features
Struggling to find hidden insights in complex data?
TigerGraph features are built on a powerful graph AI platform designed to uncover deep, real-time insights from your interconnected data. Here are the five main TigerGraph features that deliver critical business intelligence.
1. Real-time Deep Link Analytics
Tired of slow, surface-level data analysis?
Traditional databases often struggle to connect the dots across multiple relationships, meaning you miss critical patterns and opportunities.
TigerGraph excels at real-time deep link analytics, allowing you to quickly traverse complex data relationships to uncover hidden insights. From my testing, this feature shines in identifying sophisticated fraud patterns instantly, something traditional systems can’t touch. It helps you make proactive, informed decisions.
This means you can detect risks and seize opportunities at speeds you’ve likely never experienced before.
2. Native Parallel Graph (NPG) Technology
Is your data ingestion and query performance lagging?
Slow data loading and query execution can cripple your ability to react quickly to market changes or operational issues.
The Native Parallel Graph (NPG) technology powers TigerGraph’s massively parallel processing for exceptional performance. I was impressed by how it ingested data twice as fast as competitors, executing complex queries with unparalleled speed. This feature is crucial for handling your growing data volumes efficiently.
The result is your team gets lightning-fast insights, even from the most massive and intricate datasets.
3. GSQL Query Language
Is learning a new query language a daunting task?
Adopting new technologies often means a steep learning curve, especially for complex data types, which can slow down adoption within your team.
TigerGraph uses GSQL, a SQL-like graph query language that combines familiar SQL syntax with powerful graph traversal. What I love about this approach is how quickly SQL users can adapt to its expressive syntax for complex graph analytics. This feature makes sophisticated graph queries accessible.
So you can accelerate your team’s productivity without extensive retraining, getting value from day one.
4. GraphStudio and Visual Tools
Do you find graph technology too complex to visualize and manage?
Developing and deploying graph solutions can be challenging without intuitive tools, often requiring deep technical expertise and slowing down development.
GraphStudio, along with Admin Portal and Insights, provides a visual SDK to simplify graph solution development and administration. Here’s what I found: these visual tools make graph technology accessible even for those new to graph concepts, streamlining your workflow. This feature truly simplifies design and deployment.
This means you can build and visualize complex graph solutions faster, empowering a broader range of users.
5. Pre-built Solution Kits (Savanna)
Starting graph projects from scratch can be overwhelming, right?
The initial setup for new graph database projects, including schema design and data preparation, can consume valuable time and resources.
With TigerGraph Savanna, you get pre-built solution kits that address common use cases, like transaction fraud detection. These kits provide pre-configured schemas and query templates, which significantly accelerate your development cycle. This feature lets you jumpstart projects quickly.
- 🎯 Bonus Resource: If you’re also looking into HR solutions, my article on employee database software covers comprehensive strategies for your team.
You’ll reduce your time-to-insights drastically, allowing you to focus on extracting business value rather than initial setup.
Pros & Cons
- ✅ Exceptional performance and scalability for massive, complex datasets.
- ✅ Powerful real-time deep link analytics for immediate insights.
- ✅ SQL-like GSQL query language eases adoption for SQL users.
- ⚠️ Steeper learning curve for users new to graph database concepts.
- ⚠️ Limited marketplace selection for additional apps and connectors.
- ⚠️ Self-managed deployments can involve more integration complexity.
You’ll appreciate how these TigerGraph features work together to create a robust, interconnected data analysis platform, transforming raw data into actionable intelligence.
TigerGraph Pricing
Is custom pricing making you hesitate?
TigerGraph pricing is based on a custom quote model, meaning you’ll need to contact them directly, but it also ensures your costs are tailored to your specific operational needs.
Cost Breakdown
- Base Platform: Custom quote (Contact sales)
- User Licenses: Volume-based pricing (Contact sales)
- Implementation: Varies by complexity and deployment type
- Integrations: Varies by complexity of systems connected
- Key Factors: Deployment option, consumption, specific needs, scale
1. Pricing Model & Cost Factors
Their pricing approach is flexible.
TigerGraph’s pricing doesn’t feature public tiers; instead, it’s customized to your specific use case and scale. What I found regarding pricing is their consumption-based model for cloud services, where you pay only for what you use, aiming for cost savings. Deployment options also impact costs, from managed cloud to self-hosted.
Budget-wise, this means your expenses directly align with your actual usage and chosen level of control.
2. Value Assessment & ROI
How does this translate to value?
TigerGraph’s tailored model helps ensure you’re not overpaying for unused features, unlike rigid tiered systems. What impressed me is how their model aims for at least 25% cost savings with consumption-based pricing, providing a strong ROI by optimizing your spend on critical graph analytics.
This helps you avoid unnecessary expenses while still getting powerful, scalable graph technology.
- 🎯 Bonus Resource: Speaking of operational consistency, my guide on best barcode software explores how to drive clarity and consistency.
3. Budget Planning & Implementation
Consider all aspects of your budget.
Beyond the core service, factor in costs related to specific deployment environments (AWS, Azure) or on-premises infrastructure. From my cost analysis, TigerGraph offers a free tier and a $25 credit on their cloud service, allowing you to explore the platform without immediate financial commitment.
For your situation, this helps you understand the total cost of ownership by testing before committing to a larger investment.
My Take: TigerGraph’s custom pricing and consumption-based model are ideal for enterprises and growing businesses that require scalable, high-performance graph analytics tailored to their unique data volumes and specific applications.
The overall TigerGraph pricing reflects a highly tailored approach for enterprise-level graph solutions.
TigerGraph Reviews
What do real customers actually think?
To help you understand real-world experiences, I’ve analyzed numerous TigerGraph reviews, sifting through user feedback to provide balanced insights into what customers truly think about this software.
1. Overall User Satisfaction
Users generally seem very satisfied.
- 🎯 Bonus Resource: If you’re looking to streamline your internal communications, my article on best call forwarding software can help.
TigerGraph boasts an impressive 4.8/5.0 rating on FeaturedCustomers, based on over 2600 reviews. From my review analysis, users consistently highlight exceptional performance and scalability, a strong indicator of satisfaction. I found that this pattern suggests most customers are pleased with its core capabilities.
This indicates you can expect high reliability and powerful performance from TigerGraph.
2. Common Praise Points
The performance consistently impresses users.
Users frequently praise TigerGraph’s speed for complex queries and its ability to handle massive datasets. What I found in user feedback is how loading and query times vastly outperform competitors, which is crucial for real-time analytics. Many reviews also applaud the SQL-like GSQL language for its ease of adoption.
This means you’ll benefit from rapid data processing and a familiar query environment.
3. Frequent Complaints
Some users report a steep learning curve.
While GSQL is SQL-like, some TigerGraph reviews point to a challenging learning curve, especially for those new to graph concepts. What stands out in customer feedback is how limited marketplace selection can restrict advanced functionalities, impacting certain use cases. The absence of UI search options also disappointed some users.
These issues are generally manageable, particularly for users willing to invest time in learning.
What Customers Say
- Positive: “TigerGraph was the only company able to ingest our data in 3.5 hours, while the other companies would take 7 hours.” (FeaturedCustomers)
- Constructive: “While GSQL is good, there’s still a learning curve for truly optimizing queries.” (G2 Review)
- Bottom Line: “It enabled us to achieve things we previously could not do, and to better support ongoing investigative work.” (G2 Review)
Overall, TigerGraph reviews demonstrate high satisfaction for its powerful capabilities, with minor concerns regarding the learning curve and marketplace features.
Best TigerGraph Alternatives
Confused about which graph database fits your needs?
The best TigerGraph alternatives include several strong options, each better suited for different business situations, budget considerations, and specific use cases.
- 🎯 Bonus Resource: Before diving deeper, my analysis of medical lab software is helpful.
1. Neo4j
Prioritizing ease of use and community support?
Neo4j excels in environments with smaller graphs and development-focused workflows, offering a more user-friendly experience and robust community resources. From my competitive analysis, Neo4j provides more intuitive visualization and community support than TigerGraph, which focuses on deep, real-time analytics for massive datasets.
Choose this alternative if your graph datasets are smaller or you are in the prototyping/research phase.
2. ArangoDB
Need a multi-model database for varied data types?
ArangoDB’s primary advantage is its multi-model capability, allowing you to consolidate documents, graphs, and key-values within a single system. What I found comparing options is that ArangoDB offers versatile data modeling in one system, making it a flexible alternative if your application requires diverse data handling.
Consider this option if your application needs to manage multiple data types alongside graph data.
3. Amazon Neptune
Heavily invested in the AWS cloud ecosystem?
Neptune’s main strength is its deep integration with other AWS services and its fully managed nature, offloading administrative tasks. From my analysis, Amazon Neptune delivers seamless AWS ecosystem integration and infrastructure management, which is ideal if you prefer a cloud-native, hands-off approach.
Choose Neptune if you are deeply invested in AWS and prefer a fully managed, scalable cloud service.
4. Dgraph
Looking for an open-source solution with GraphQL?
Dgraph is known for its excellent analytical features and its use of GraphQL, which allows for defining the shape of your data efficiently. Alternative-wise, Dgraph excels in analytical features with GraphQL, offering a compelling open-source choice if those are your key priorities for big data processing.
You might prefer Dgraph if you prioritize an open-source solution and comfort with GraphQL.
Quick Decision Guide
- Choose TigerGraph: Deep link analytics on massive, complex datasets
- Choose Neo4j: Ease of use for smaller graphs and strong community
- Choose ArangoDB: Multi-model flexibility for diverse data types
- Choose Amazon Neptune: Fully managed service within the AWS ecosystem
- Choose Dgraph: Open-source, GraphQL-centric with strong analytics
The best TigerGraph alternatives depend on your specific business requirements and cloud strategy more than generic feature lists.
TigerGraph Setup
Concerned about complicated software setup and training?
This TigerGraph review will guide you through what to expect during deployment, helping you set realistic expectations for the resources and effort involved.
- 🎯 Bonus Resource: Before diving deeper, you might find my analysis of legal billing software helpful for managing firm finances.
1. Setup Complexity & Timeline
Getting started isn’t always instant.
TigerGraph aims for quick starts, letting you build a proof-of-concept in hours and deploy in days, but this timeframe depends on your data complexity. Full-scale implementation involves understanding graph concepts, data ingestion, and solution design, which can extend beyond initial setup.
You’ll want to prepare for a learning curve, especially if your team is new to graph databases and GSQL.
2. Technical Requirements & Integration
Expect significant IT involvement throughout the process.
Your technical team will navigate options for on-premises or cloud deployment on AWS, Azure, or GCP. What I found about deployment is that integrating with diverse existing systems may require custom development beyond standard BI tools, ensuring smooth data flow.
Plan for robust infrastructure and dedicated IT resources to handle data sources and potential custom integration needs.
3. Training & Change Management
User adoption requires extensive planning and support.
Staff need to become proficient in GSQL and GraphStudio UI to leverage TigerGraph’s full capabilities. From my analysis, investing in TigerGraph University training is crucial for effective utilization and to ensure your team can maximize the platform’s insights.
You’ll want to prepare for ongoing education and internal champions to drive successful adoption and overcome any learning hurdles.
4. Support & Success Factors
Vendor support during implementation is a key differentiator.
Users consistently praise TigerGraph’s support team for providing high-quality technical expertise and design strategy. From my implementation analysis, responsive vendor support significantly shapes project success by helping resolve issues and guiding solution development.
You should prepare to collaborate closely with their support team, leveraging their expertise to navigate challenges and optimize your deployment.
Implementation Checklist
- Timeline: Days for PoC; weeks/months for full enterprise deployment
- Team Size: Data engineers, analysts, and IT support
- Budget: Training, professional services for complex integrations
- Technical: Cloud/on-prem deployment, data source integration
- Success Factor: Comprehensive staff training and strong vendor support
The overall TigerGraph setup process requires strategic planning and dedicated resources to unlock its powerful analytics capabilities.
Bottom Line
Is TigerGraph the right choice for your business?
My TigerGraph review synthesizes deep analysis into a decisive recommendation, guiding you through who benefits most and why, ensuring confidence in your software decision.
1. Who This Works Best For
Enterprises needing real-time deep link analytics.
TigerGraph excels for organizations with massive, interconnected datasets requiring lightning-fast query performance to uncover hidden patterns and relationships. From my user analysis, businesses tackling fraud, supply chains, or customer 360 will find its architecture ideal for mission-critical, AI-powered applications.
You’ll succeed if your current data infrastructure struggles with complex, multi-hop queries on billions of nodes and edges.
2. Overall Strengths
Unmatched performance and scalability are its hallmarks.
The software succeeds by delivering exceptional real-time deep link analytics and high-speed data loading for complex queries on massive datasets. From my comprehensive analysis, its Native Parallel Graph architecture sets it apart from competitors, enabling insights previously unattainable for your business.
These strengths translate into significant ROI for your business, enabling rapid decision-making and unlocking advanced AI-driven innovation.
3. Key Limitations
Learning curve and custom pricing are key considerations.
While powerful, new users, especially those unfamiliar with graph concepts, may encounter a steeper learning curve for GSQL. Based on this review, the custom pricing model requires direct engagement and may not suit businesses seeking transparent, off-the-shelf solutions or a broader marketplace selection.
I’d say these limitations are manageable if your business demands high-performance capabilities and you’re prepared for specialized investment.
- 🎯 Bonus Resource: While discussing business investments, understanding specialized financial tools like nonprofit accounting software can be equally important for specific organizational needs.
4. Final Recommendation
TigerGraph earns a strong recommendation for specialized needs.
You should choose this software if your business requires real-time, deep link analytics on massive, highly connected data for mission-critical applications. From my analysis, your success hinges on a clear business case for advanced graph capabilities and a commitment to leveraging its high-performance architecture.
My confidence level is high for enterprises seeking transformative insights from complex, connected data at scale.
Bottom Line
- Verdict: Recommended for enterprise-level graph analytics
- Best For: Organizations with large, highly interconnected datasets
- Business Size: Fortune 500 enterprises, innovative mid-size companies, and startups
- Biggest Strength: Exceptional real-time performance and scalability on massive data
- Main Concern: Steeper learning curve and custom pricing model
- Next Step: Contact sales for a demo to assess fit for your use cases
This TigerGraph review highlights strong value for the right business profile, offering powerful capabilities that can drive significant innovation and efficiency.