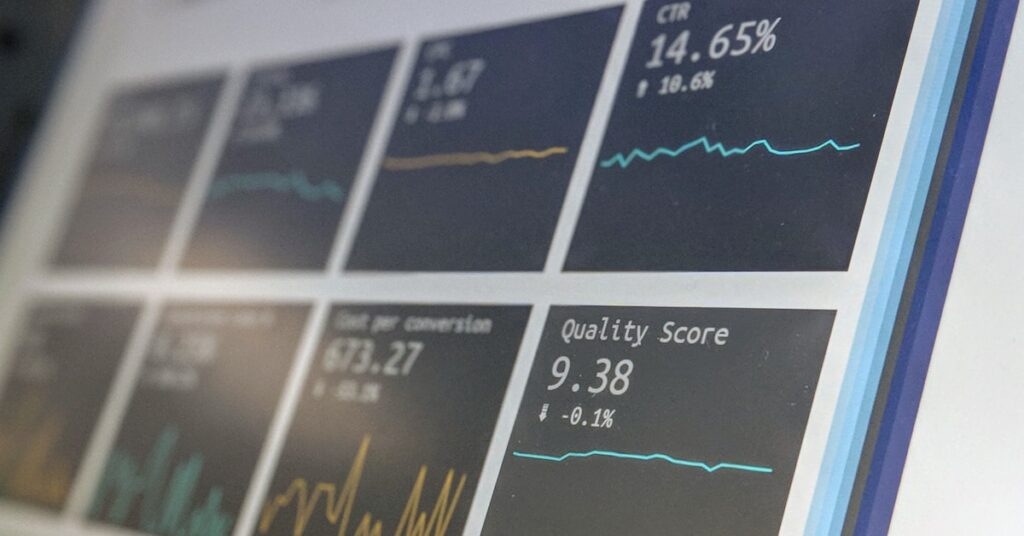
Drowning in data but starved for insights?
You have spreadsheets overflowing with numbers, but extracting clear, actionable intelligence feels nearly impossible with outdated or overly complex tools.
The real problem is wasting valuable time on manual analysis when you should be making the strategic decisions that drive real growth for your business.
Relying on raw data or clunky charts often leads to critical misinterpretations. This can result in poor, costly decisions that set your company back.
But the right tool changes everything. It empowers you to turn complex datasets into clear stories that anyone on your team can finally understand.
In this guide, I’ve done the heavy lifting for you. I’m going to break down the best data visualization tools to accelerate your insight and refine your decisions.
You’ll discover platforms that simplify analysis, integrate with your existing stack, and help you present compelling data-driven narratives to your stakeholders.
Let’s get started.
Quick Summary:
| # | Software | Rating | Best For |
|---|---|---|---|
| 1 | Tableau → | Large enterprises | |
| 2 | Microsoft → | Enterprise businesses | |
| 3 | Looker → | Mid-sized to enterprises | |
| 4 | Domo → | Large enterprises | |
| 5 | Qlik → | Data analysts & BI managers |
1. Tableau

Struggling with data overload and slow insights?
Tableau helps you turn raw data into trusted insights with its visual analytics platform. You can see, understand, and act on your data quickly.
This means you can transform data into autonomous action, anytime, anywhere, without getting bogged down by complex software. You’ll find it much easier to ask questions of your data.
Here’s how to unlock its full potential.
Tableau’s visual analytics platform empowers you to explore data limitlessly, without interrupting your analysis flow. You can deploy it in the cloud, on-premises, or natively integrate it with Salesforce CRM.
You’ll find its built-in visual best practices make data analysis intuitive, not a struggle. Additionally, you can connect to all your data with fully integrated AI/ML capabilities, governance, and data management. Tableau also offers visual storytelling and collaboration features.
Plus, with Tableau Next and Tableau Agent, you get trusted AI assistants that accelerate data-driven decisions and streamline data preparation, helping you create visualizations faster using conversational AI.
The result is faster data, insights, and action.
While we’re discussing powerful software tools for data, you might also be interested in my guide on best engineering industry software.
Key features:
- Intuitive Visual Analytics: Transforms raw data into clear, actionable insights through visual best practices, enabling limitless exploration without interrupting your analysis.
- Integrated AI/ML Capabilities: Leverages advanced AI and machine learning to deliver trusted insights, accelerate data preparation, and create visualizations faster with conversational AI.
- Flexible Deployment & Governance: Allows deployment in the cloud or on-premises, natively integrating with Salesforce CRM, alongside robust governance and data management.
Tableau features, pricing, & alternatives →
Verdict: Tableau stands out as one of the best data visualization tools, proven by companies like KeyBank empowering 10K employees and JLR delivering £250M in business value. Its AI-powered insights and intuitive platform help you gain strategic clarity and accelerate efficiency.
2. Microsoft
Struggling to translate complex data into clear insights?
Microsoft offers Microsoft 365 and Copilot, integrating AI to streamline your workflows. This means less time wrestling with data.
You can achieve extraordinary outcomes by leveraging cloud storage and enhanced security, ensuring your valuable data is protected while you focus on analysis. Here’s how this empowers you.
Unlock AI features for powerful analysis.
Microsoft 365 delivers cloud storage, security, and Copilot in your favorite apps, all within one plan, simplifying data management. This allows your team to focus on the things that matter most with AI in Microsoft 365 for business. Additionally, Visual Studio 2022 provides a comprehensive IDE for building web, cloud, desktop, and mobile apps, offering robust development capabilities to complement your data visualization efforts.
Plus, Copilot is your AI companion, always by your side, ready to support you whenever and wherever you need it, ensuring continuous assistance for data tasks. Windows 11 for Business, designed for hybrid work, offers a powerful, consistent, and secure environment for your employees, further enhancing productivity. The result is accelerated insight.
Before diving deeper, you might find my analysis of best Android kiosk software helpful for ensuring a secure customer experience.
Key features:
- Microsoft 365 delivers cloud storage, security, and Copilot in your favorite apps, offering an integrated platform for data management.
- Microsoft Copilot is your AI companion, ready to support you whenever and wherever you need it, streamlining data analysis and reporting.
- Visual Studio 2022 provides a comprehensive IDE for developing web, cloud, desktop, and mobile apps, supporting complex data visualization solutions.
Microsoft features, pricing, & alternatives →
Verdict: If you’re seeking to enhance your data analysis capabilities and accelerate insights, Microsoft provides a robust ecosystem making it one of the best data visualization tools. Its integration of AI with Microsoft 365 and Visual Studio offers scalable solutions for complex datasets, helping your team make more informed decisions efficiently.
3. Looker

Struggling with inconsistent data and slow insights?
Looker offers a powerful universal semantic modeling layer for consistent results. This means you will see reliable metrics regardless of where they are consumed.
Looker helps you curate and govern crucial business metrics, providing a single source of truth across your organization. You get reliable data, eliminating common discrepancies.
Time to turn data into action.
Looker, leveraging Google’s AI innovations, delivers an intelligent BI solution by combining foundational AI with a flexible semantic layer. This allows your team to analyze governed data, deliver insights, and build AI-powered applications.
With Gemini in Looker, you can accelerate analytical workflows, including creating visualizations, formulas, and reports, backed by robust semantic and Gemini foundational models. This AI assistant helps your team quickly uncover deep insights. Additionally, Looker Reports provide intuitive, drag-and-drop dashboarding with visually stunning capabilities, allowing your entire organization to craft compelling data stories from various sources while maintaining data integrity. Your users gain self-service capabilities to explore data and drill down to row-level detail for full understanding.
You can gain actionable insights from complex datasets.
Key features:
- Universal Semantic Modeling Layer: Provides a single, trusted source for all your business metrics, ensuring consistent results and governed data across your organization.
- AI-Powered Analytics with Gemini: Accelerates analytical workflows, including visualization and report creation, through an intuitive, conversational AI assistant for mass appeal.
- Google-Easy Reporting and Dashboarding: Offers drag-and-drop canvas and stunning visualizations, enabling self-service ad-hoc analysis and robust governance for all users.
Looker features, pricing, & alternatives →
Verdict: Looker stands out as one of the best data visualization tools for mid-sized to enterprise companies, offering a unified, governed data foundation through its semantic layer and powerful AI-driven analytics. Its Google-easy interface and robust reporting capabilities ensure efficient, consistent insights for faster decision-making.
4. Domo
Struggling to transform raw data into actionable insights?
Domo offers robust data integration and visualization tools to tackle this. This means you can connect and prepare data from any source.
Your team can then explore expanded data access and build powerful data products to accelerate business insights. The result is faster, more accurate decision-making.
Here’s how Domo helps.
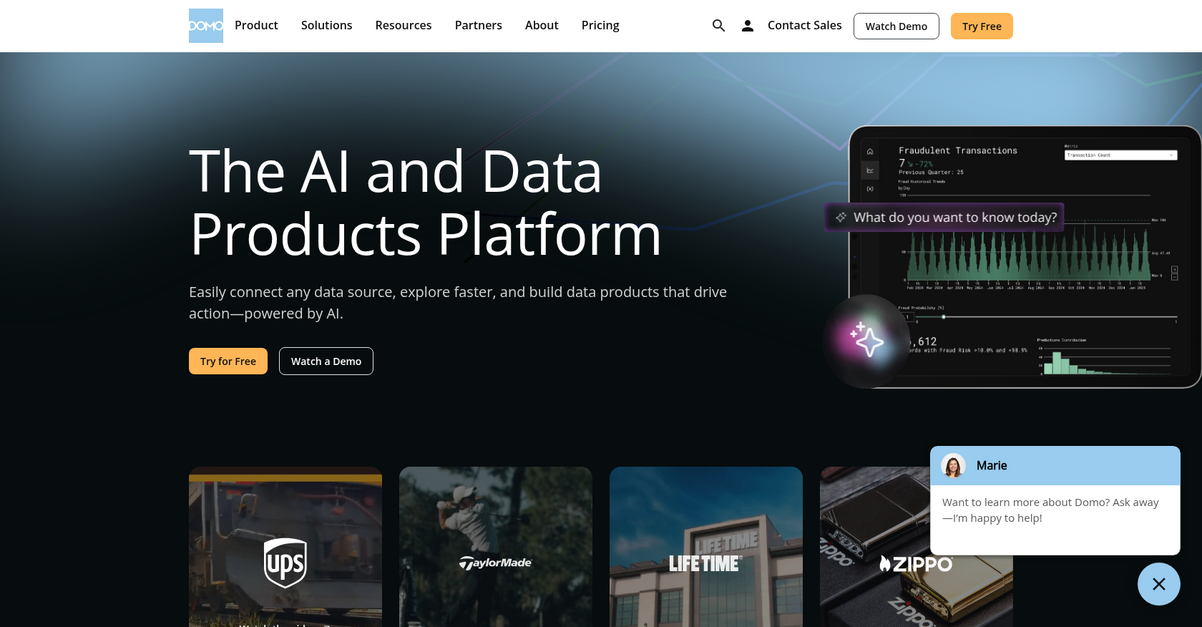
Domo provides an AI and data products platform designed to accelerate your insights. This includes powerful data integration tools to connect, centralize, and prepare your data, ensuring it’s ready for analysis.
You can discover and share insights instantly, anywhere, with intuitive business intelligence features like charts and dashboards. Additionally, Domo offers intelligent automation with no-code workflows and AI agents, allowing you to streamline operations and reduce costly errors. Plus, you can explore and share data through secure data products and conversational AI, helping you analyze data and uncover trends.
The result is a comprehensive solution for enhanced decision-making.
Key features:
- Data Integration & ETL: Connect, centralize, and prepare data from any source with powerful drag-and-drop ETL capabilities and extensive connectors (e.g., Salesforce, SAP, Excel).
- Business Intelligence & Visualization: Create impactful visualizations, charts, and dashboards to discover and share insights instantly, anywhere, with capabilities for self-service reporting.
- Intelligent Automation & AI: Utilize secure, private AI experiences and AI agents to automate tasks, create workflows, and gain AI-assisted insights, improving productivity.
Domo features, pricing, & alternatives →
Verdict: If you’re seeking the best data visualization tools that combine advanced analytics with intelligent automation and AI, Domo is an excellent choice. It excels at helping you prepare data for AI, and a customer saved “100s of hours of manual processes” using Domo’s automated dataflow engine.
5. Qlik
Struggling to transform raw data into clear insights?
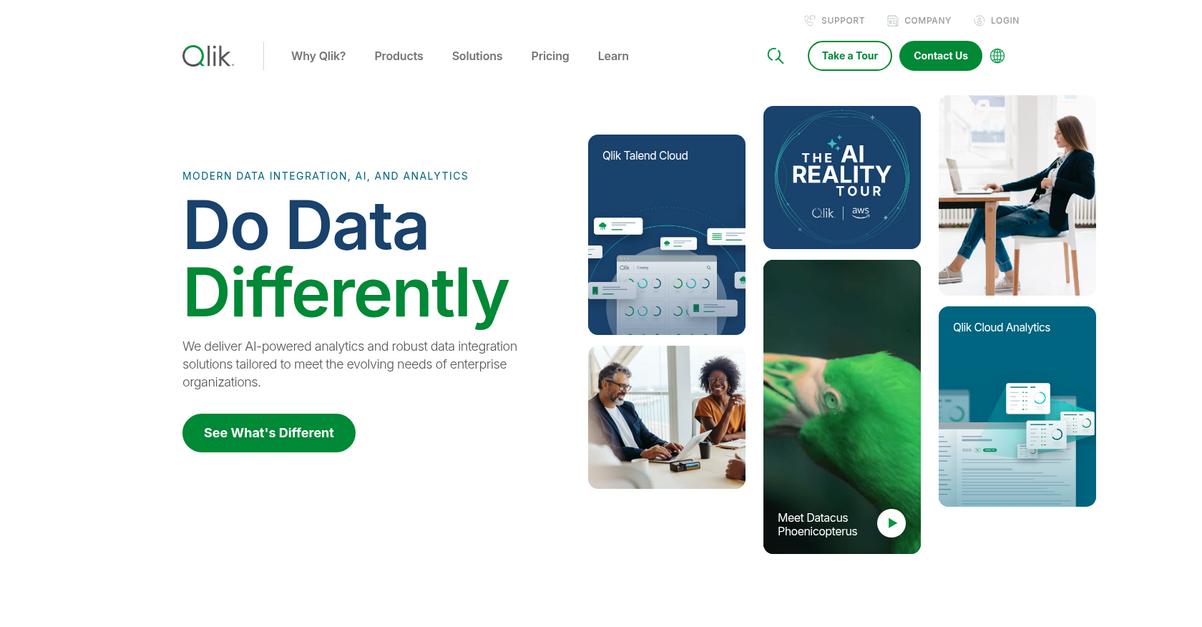
Qlik Sense helps you unify your data and explore it freely, revealing hidden connections you might miss.
This means you can uncover deeper insights across your entire organization, making sense of complex information and improving your decision-making.
So, how does it work?
Qlik’s associative engine lets you explore data from every angle, without limitations, making discoveries you didn’t anticipate.
You can analyze information from various sources and see how everything relates, giving you a complete picture for better decisions. This unique approach allows you to freely explore and understand your data in context, leading to faster, more confident actions.
Plus, you get the power of AI to augment your analytics, helping you find relevant insights and guiding your analysis for improved outcomes.
Make data-driven decisions with confidence.
While we’re discussing how businesses improve through data, understanding best customer self service software can also enhance operations.
Key features:
- Associative Engine: Connects all your data sources, allowing for unrestricted exploration and discovery of insights that traditional query-based tools might miss.
- Augmented Analytics: Leverages AI and machine learning to identify hidden patterns, suggest relevant analyses, and guide users to deeper, more actionable insights.
- Unified Data View: Provides a comprehensive, consolidated perspective of your data, enabling cross-organizational analysis and informed decision-making across all departments.
Qlik features, pricing, & alternatives →
Verdict: Qlik stands out as one of the best data visualization tools for data analysts and BI managers seeking comprehensive, AI-powered insights. Its unique associative engine ensures you never miss a data point, enabling faster, more confident decision-making that drives business growth.
6. Zoho
Tired of scattered data and unclear insights?
This means you need a unified system to make sense of your business information.
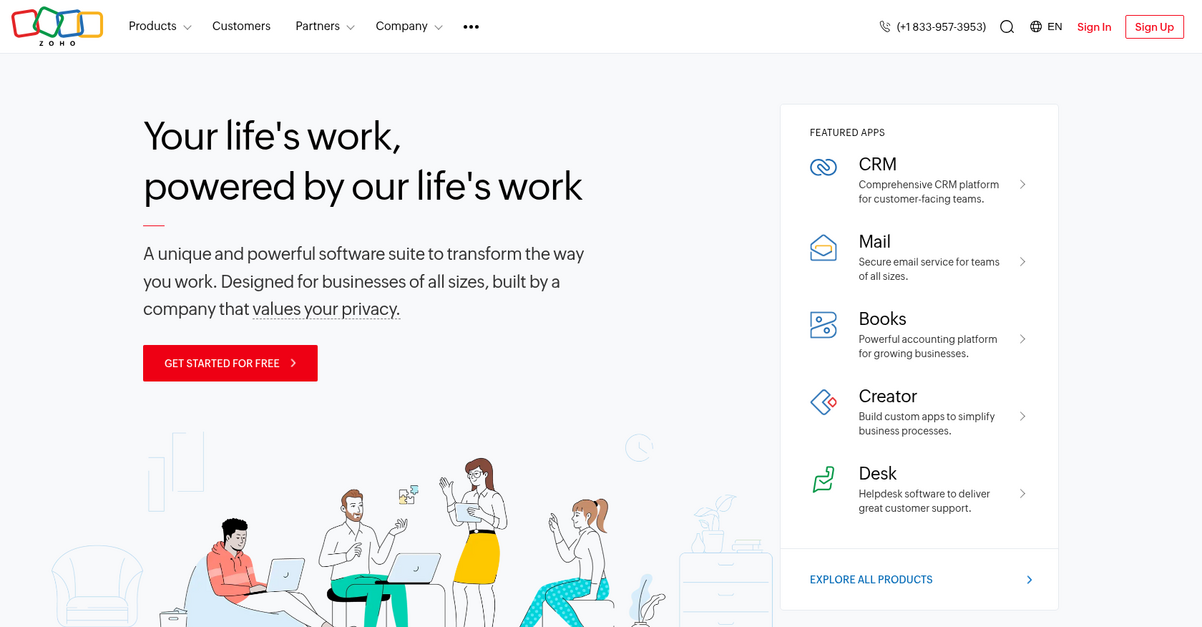
Zoho’s unified cloud software helps you break down silos between departments and increase organizational efficiency, addressing key pain points for data analysts.
It’s time for better data management.
Zoho One serves as an operating system for your entire business, transforming how you work by unifying disparate data. This allows you to track sales, investments, and client potential by bringing all your data into one cohesive platform.
You can customize Zoho for your business, providing autonomous control and enabling you to streamline complex processes and build stronger customer relationships. Additionally, it helps you automate processes and track business growth easily, enhancing your overall productivity.
The result: Your business gains critical insights, driving significant growth and efficiency.
While optimizing business processes, you might also be exploring ways to educate your team. My guide on online course creation software can help.
Key features:
- Unified cloud software: Consolidates all your business data into a single platform, eliminating data silos and improving organizational efficiency for comprehensive analysis.
- Comprehensive CRM platform: Specifically designed for customer-facing teams, allowing for effective tracking of sales, investments, and client interactions to improve decision-making.
- Customizable business management: Offers autonomous control to tailor the platform to your specific business needs, simplifying HR processes and automating workflows for enhanced productivity.
Zoho features, pricing, & alternatives →
Verdict: Zoho offers a robust, all-in-one suite that unifies your data and streamlines processes, making it one of the best data visualization tools for businesses of all sizes. It delivers significant productivity gains, with one user reporting an 80% increase, demonstrating its impact on operational efficiency.
7. Klipfolio
Struggling with scattered data and unclear insights?
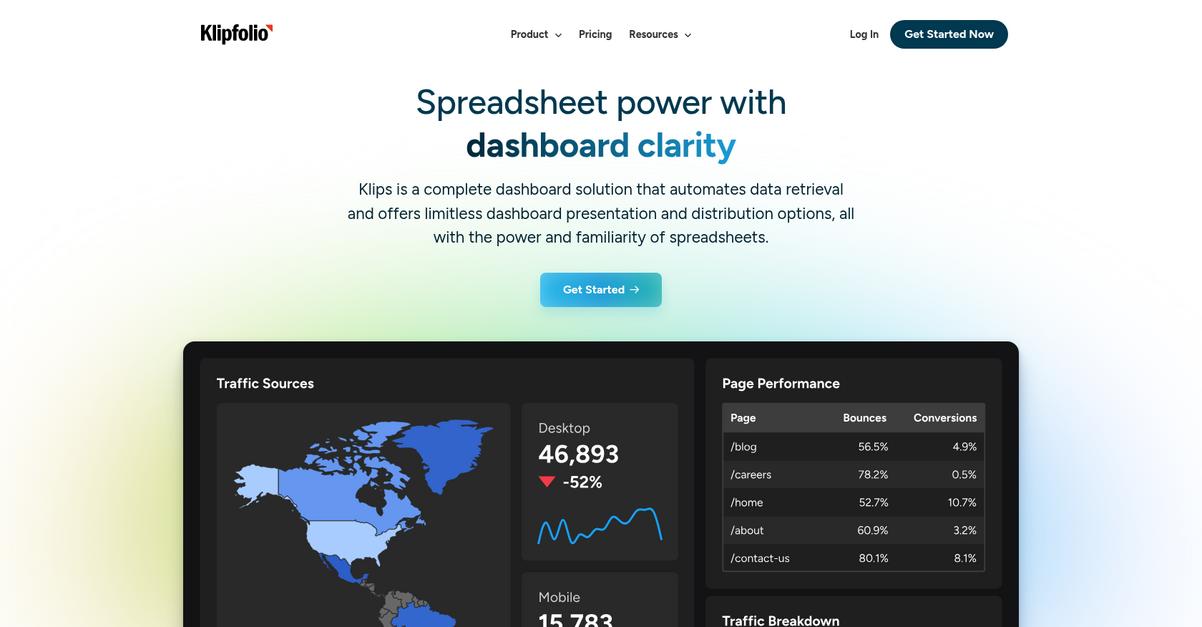
Klipfolio Klips directly connects to hundreds of services and APIs, helping you build highly customizable dashboards and reports.
This means you can pull live data straight from Excel or Google Sheets, automating data retrieval so you stop chasing yesterday’s numbers.
The result: a complete dashboard solution.
Klipfolio offers seamless integration with over 200 services, from your CRM to Google Ads, ensuring your data remains connected and reliable. This eliminates manual grunt work and brings all your data together for insightful dashboards. You can also access data from almost anywhere with robust query connectors, whether you use a data warehouse or not. Additionally, features like automatic data refresh, refresh scheduling, and dynamic data sources streamline your data management workflow, allowing you to focus on analysis rather than data preparation.
This makes decision-making confident and efficient.
While we’re discussing APIs, understanding API security testing tools is equally important for data integrity.
Key features:
- Highly customizable dashboards Klips empowers you to build tailored dashboards and reports with pixel-level control, custom theming, and white-label options, ensuring clear visual storytelling for your team and clients.
- Automated data management Say goodbye to manual data pulling with Klips’ automatic data refresh, refresh scheduling, and dynamic data sources that automate your workflow for real-time insights.
- Extensive data connectivity Connect directly to over 200 services and APIs, including spreadsheets, CRMs, and ad platforms, and use robust query connectors for SQL and REST, making your data reliable and centralized.
Klipfolio features, pricing, & alternatives →
Verdict: If you’re seeking the best data visualization tools that combine the power of spreadsheets with advanced dashboard clarity, Klipfolio is an excellent choice. Its ability to automate data retrieval from various sources, build highly customizable dashboards, and facilitate confident decision-making makes it a strong contender for your team.
8. Datawrapper
Struggling to visualize complex data quickly and clearly?
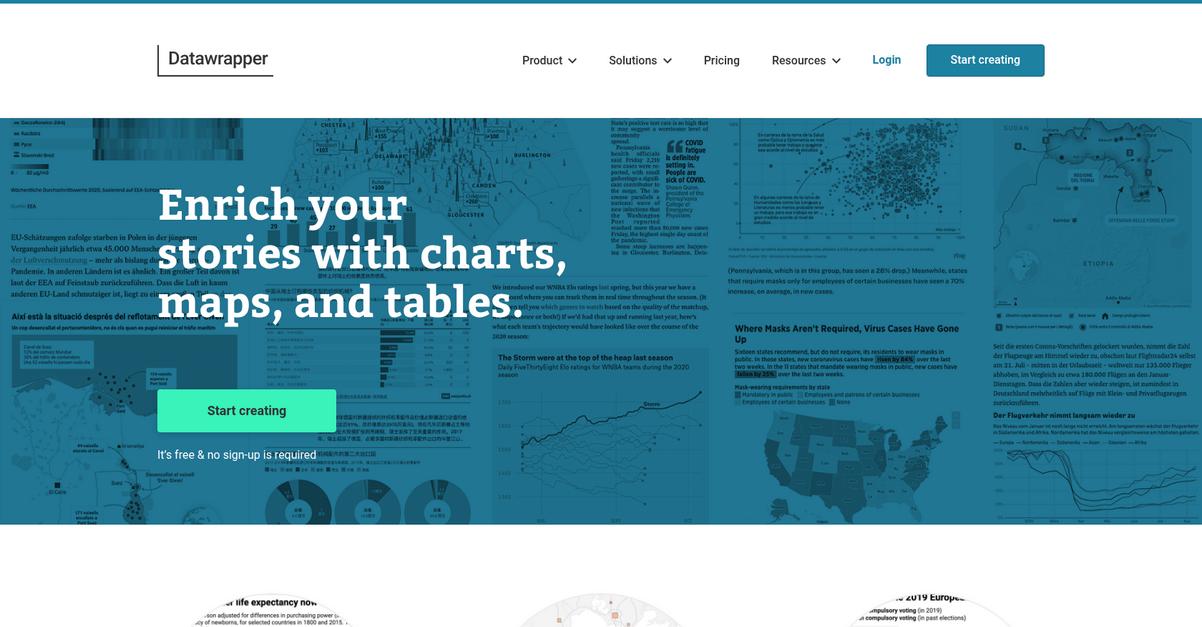
Datawrapper helps you transform raw data into stunning, interactive charts, maps, and tables with just a few clicks. This means you can create impactful visuals without needing extensive design or coding skills.
You’ll discover how Datawrapper’s features like 20 chart types and responsive tables streamline your workflow, enabling better decision-making from complex datasets. The result is accelerating your insight.
Discover seamless data visualization for impactful decisions.
Datawrapper empowers you to communicate with data effectively, whether you’re a data analyst or a business intelligence manager. Here’s how you can simply copy your data from Excel, Google Sheets, or CSV files and instantly choose from a variety of chart, map, and table types. This ease of use minimizes time spent on visualization methods, letting your team focus on insights.
Additionally, Datawrapper offers features like custom themes to match your brand’s style, responsive designs that look great on any device, and even a dark mode. Plus, you can collaborate with your team using shared folders and export your creations as PNG, SVG, or print-ready PDFs, ensuring seamless integration into your reports or publications.
Ultimately, your decisions become more efficient and drive business growth.
Key features:
- Intuitive Interface: Easily transform your data into charts, maps, and tables with a simple copy-paste function, removing the need for coding or design expertise.
- Diverse Visualization Options: Access over 20 interactive chart types, three map types including choropleth and locator, and responsive tables with styling options and search capabilities.
- Collaboration & Customization: Collaborate effectively with shared folders, integrate with tools like PowerPoint, and customize visualizations with brand-specific themes and print-ready exports.
Datawrapper features, pricing, & alternatives →
Verdict: If you’re seeking the best data visualization tools that blend advanced capabilities with exceptional ease of use, Datawrapper is an excellent choice. Its ability to turn data into interactive charts, maps, and tables quickly, coupled with robust collaboration features and flexible export options, streamlines your data communication and enhances decision-making efficiency.
Conclusion
Time to unlock your data’s story.
Choosing the right tool feels overwhelming in a crowded market. You need a platform that turns complex datasets into clear, actionable intelligence without a steep learning curve.
Relying on outdated tools just leads to missed opportunities. Your team wastes valuable time on manual analysis instead of focusing on the strategic decisions that actually grow your business.
Here’s the best path forward.
If you’re also evaluating other business tools, my guide on best student management system offers valuable insights.
From everything I’ve reviewed, Tableau is the clear winner. Its powerful visual analytics platform helps you see, understand, and act on your data almost instantly.
What I love is its intuitive, AI-powered platform that makes analysis flow naturally. It’s why it’s my top pick for the best data visualization tools to accelerate your efficiency.
I highly recommend you start a free trial of Tableau to experience its full potential. See how it transforms data for your team.
You’ll make better decisions, faster.
