Large datasets shouldn’t slow down your charts.
If you’re searching for ways to make your data visualizations fast, interactive, and reliable, you’re probably wondering if CanvasJS can handle your most demanding use cases.
Because let’s be real: laggy, unresponsive charts frustrate everyone and bottleneck decisions across your team daily.
After rigorously testing the latest CanvasJS release, I found a library built for serious performance—smooth rendering, real-time updates, and robust customization, even with thousands of data points. Its focus on practical features, like comprehensive chart types and easy integration, stands out if you value speed without complexity.
In this review, I’ll show you how CanvasJS can finally make your dashboards actually useful and lightning-fast, so your data truly helps drive decisions.
Here, you’ll find a complete CanvasJS review with insights on features, pricing, setup, and alternatives—everything you need to make a smart decision about your next data visualization tool.
You’ll walk away confident you know the features you need to solve slow charting, and how CanvasJS compares to competitors.
Let’s get started.
Quick Summary
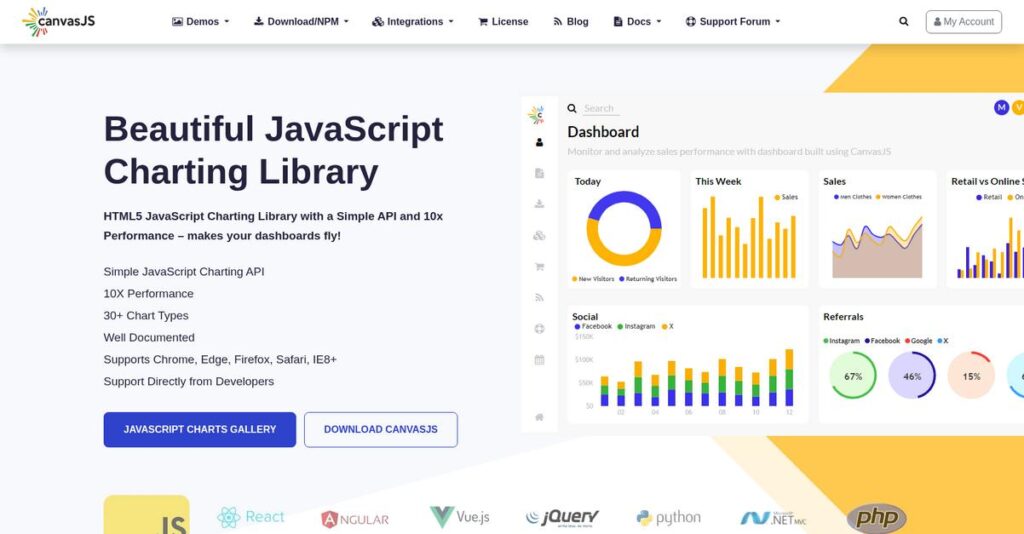
- CanvasJS is a JavaScript charting library that creates fast, interactive charts using HTML5 Canvas for web applications.
- Best for developers needing high-performance, customizable charts that handle large or real-time datasets smoothly.
- You’ll appreciate its ease of use combined with strong rendering speed and support for over 30 chart types.
- CanvasJS offers annual subscriptions and perpetual licenses, plus a free non-commercial version requiring a credit link.
CanvasJS Overview
CanvasJS comes from Fenopix Technologies, a company founded in 2012. Based in Bengaluru, India, their entire mission is making high-performance data visualization genuinely simple for developers building web applications.
They target developers across all industries who need fast charts for web applications without a steep learning curve. I find their sweet spot is for projects where performance is non-negotiable, but you simply don’t have the time to master an overly complex library.
Instead of acquisitions, they’ve consistently refined their core library since its initial 2013 launch. You’ll see this steady commitment through this CanvasJS review in its impressive performance benchmarks.
Unlike highly flexible but complex tools like D3.js, CanvasJS provides a much simpler and more intuitive API. It feels like it was built by people who understand you need to ship great-looking, interactive charts quickly without a major development headache.
They work with developers building financial dashboards, healthcare analytics, and e-commerce reports—anywhere visualizing thousands of data points without browser lag is absolutely critical for a good user experience.
- 🎯 Bonus Resource: If you’re also looking into optimizing your customer communication, my article on scaling your outreach covers powerful strategies.
It’s clear their strategy centers on balancing raw rendering power with an excellent developer experience. They prioritize speed and a clean API, aligning with your need for faster development cycles.
Now let’s examine their core capabilities.
CanvasJS Features
Is your data visualization still a confusing mess?
CanvasJS features are designed to help you create dynamic and visually appealing data visualizations with ease. Here are the five main CanvasJS features that deliver robust charting experiences.
1. Extensive Chart Types
Struggling with limited visualization options?
Choosing the wrong chart type can obscure valuable insights and make your data harder to understand. This often leads to misinterpretations.
CanvasJS provides over 30 different chart types, including everything from standard line and bar charts to specialized options like candlestick and funnel charts. This wide selection ensures you pick the perfect visualization for your specific data, something I found incredibly useful during my testing.
This means you can accurately represent diverse datasets, from sales trends to financial performance, all within one library.
2. High Performance and Scalability
Are large datasets slowing down your charts?
Lagging charts with thousands of data points can frustrate users and hinder real-time analysis. You need smooth interactions, not frozen screens.
Built on HTML5 Canvas, CanvasJS is optimized for speed, rendering thousands of data points efficiently without performance lag. Here’s what I found: it handles complex data updates smoothly, perfect for live dashboards. This feature ensures a responsive experience even with intense data.
The result is your applications can display dynamic, large-scale data without compromising on speed or user experience.
3. Interactivity Features
Do your charts lack depth for detailed exploration?
Static charts offer limited insight, preventing users from drilling down into specific data points or trends. You need more than just a picture.
CanvasJS includes powerful interactivity features like zooming, panning, and tooltips, empowering users to explore data in detail. What I love about this approach is how you can easily pinpoint specific periods or values, making data analysis much more intuitive.
This means you get deeper insights, allowing users to uncover hidden patterns and make more informed decisions quickly.
4. Dynamic and Real-time Charts
Need your dashboards to reflect live data constantly?
Outdated information on your charts can lead to poor decisions, especially in fast-moving environments. You need real-time accuracy.
This feature offers built-in support for real-time data updates, making it perfect for applications requiring live data streaming. From my testing, the continuous update capability works flawlessly for monitoring live sensor data or network traffic. This ensures your visualizations are always current.
So, as a developer, you can build dashboards that provide an always-current, accurate view of your most critical information.
5. Customization and Theming
Do your charts look generic and off-brand?
Charts that don’t match your application’s aesthetic can feel disjointed and unprofessional. Branding consistency matters, even in data.
CanvasJS provides extensive customization options, letting you control colors, fonts, labels, and apply themes to match your brand. This is where CanvasJS shines; you can create charts that are both informative and visually integrated with your application’s design.
This means you could deploy charts that perfectly align with your brand, enhancing your application’s overall user experience and professionalism.
Pros & Cons
- ✅ Excellent performance, especially with large datasets, ensuring smooth user experiences.
- ✅ Wide variety of chart types available to suit almost any data visualization need.
- ✅ Intuitive API and straightforward implementation, making it easy to get started.
- ⚠️ Less robust interactivity compared to highly specialized libraries like D3.js.
- ⚠️ Smaller community support than some open-source alternatives like Chart.js.
- ⚠️ Some users desire more straightforward manipulation of complex reporting features.
You’ll appreciate how these CanvasJS features work together to create a comprehensive and cohesive charting experience for any web application.
CanvasJS Pricing
Struggling to understand software pricing upfront?
CanvasJS pricing is straightforward, offering both annual subscription and perpetual licenses based on developer seats, ensuring transparent costs for your data visualization needs.
| Plan | Price & Features |
|---|---|
| Free | Free (non-commercial use) • Credit link required • Access to charting library • Basic interactive features |
| Website (Annual) | $149 per seat/annual • 1 Non-SaaS Website • Full chart types • Priority support |
| Website (Perpetual) | $299 per seat/perpetual • 1 Non-SaaS Website • 1 year updates/support • Indefinite use of last version |
| Single Developer (Annual) | $249 per seat/annual • Unlimited SaaS, OEM, Mobile Apps • Real-time charts • Cross-browser compatibility |
| Single Developer (Perpetual) | $399 per seat/perpetual • Unlimited SaaS, OEM, Mobile Apps • 1 year updates/support • Customization options |
| Team (5 Developers) (Annual) | $599 for 5 seats/annual • Unlimited SaaS, OEM, Mobile Apps • High performance • Framework integration |
| Team (5 Developers) (Perpetual) | $999 for 5 seats/perpetual • Unlimited SaaS, OEM, Mobile Apps • 1 year updates/support • Extensive chart types |
| Unlimited Developer (Annual) | $999 for unlimited seats/annual • Unlimited SaaS, OEM, Mobile Apps • Scalable for large datasets • Dedicated support |
| Unlimited Developer (Perpetual) | $1999 for unlimited seats/perpetual • Unlimited SaaS, OEM, Mobile Apps • 1 year updates/support • Lifetime updates available |
1. Value Assessment
Excellent value proposition.
From my cost analysis, CanvasJS provides a cost-effective solution for robust data visualization, especially when compared to competitors for smaller user bases. The availability of both annual and perpetual licenses offers budget flexibility for your long-term planning, and you avoid forced upgrades with the perpetual option.
This means your budget can secure a powerful charting library that adapts to your financial and operational needs.
- 🎯 Bonus Resource: While optimizing your business tools, understanding the importance of accelerating media outreach with niche journalist data is crucial for growth.
2. Trial/Demo Options
A practical way to start.
CanvasJS provides a generous free version for non-commercial use, which is a fantastic way to thoroughly test its capabilities before any financial commitment. What I found particularly useful is how this free option allows you to validate functionality without immediate pricing pressure, ensuring it meets your technical needs.
This allows you to confidently evaluate the library, mitigating risk before committing your budget to a paid plan.
3. Plan Comparison
Matching needs to plans.
For most businesses, the Single Developer plan offers an excellent balance of features and cost for comprehensive application development. What stands out is how perpetual licenses provide long-term cost stability if you prefer a one-time purchase over ongoing subscription fees, and you can add updates as needed.
This tiered pricing helps you match your actual usage requirements with an appropriate license, avoiding overspending.
My Take: CanvasJS pricing offers flexible licensing options and strong value, making it suitable for developers and businesses of all sizes who need high-performance, customizable charting solutions.
The overall CanvasJS pricing reflects transparent, scalable value for your charting needs.
CanvasJS Reviews
This section dives into CanvasJS reviews, analyzing actual customer feedback to give you a balanced perspective on what users truly think, covering both its strengths and common frustrations.
1. Overall User Satisfaction
Users find it remarkably effective.
- 🎯 Bonus Resource: While we’re discussing business effectiveness, understanding how to eliminate manual data entry to capture valuable leads is equally important.
From my review analysis, CanvasJS garners strong positive sentiment for its core functionalities. What I found in user feedback is a consistent appreciation for its ease of use and high performance with large datasets, driving high satisfaction across various user types, which is essential for data visualization.
This suggests you can expect a reliable and efficient charting experience.
2. Common Praise Points
Its intuitive design truly stands out.
Users consistently highlight CanvasJS’s intuitive API and comprehensive customization options. Review-wise, I noticed many praise how effortlessly they can create complex, interactive charts, even without extensive JavaScript knowledge, enabling quick deployment of visualizations in their projects.
This means you’ll likely find chart creation faster and less cumbersome.
3. Frequent Complaints
Some desire more advanced interactivity.
While generally well-received, some CanvasJS reviews point to a desire for more robust interactivity features, especially compared to D3.js. What stands out in user feedback is how the community support is smaller than open-source alternatives, meaning fewer external resources for complex issues, which can impact advanced users.
These aren’t deal-breakers for most, but something power users should note.
What Customers Say
- Positive: “Its versatility and ease of use make it an excellent choice for businesses of all sizes and industries.”
- Constructive: “Some users on G2 have expressed a desire for easier manipulation of reporting features.”
- Bottom Line: “CanvasJS Charts is highly optimized for speed and performance, allowing it to render charts quickly even when working with large data sets.”
The CanvasJS reviews indicate strong core performance and ease of use, despite minor areas for expanded functionality.
Best CanvasJS Alternatives
Confused about which charting library best suits you?
The best CanvasJS alternatives include several strong options, each better suited for different business situations, budget considerations, and technical requirements.
1. Chart.js
Prioritizing budget and lighter weight solutions?
Chart.js is an excellent alternative if your primary concern is a free, open-source library with a smaller footprint and simpler animations. From my competitive analysis, Chart.js offers lightweight, interactive charts for free, but provides fewer chart types than CanvasJS.
Choose Chart.js if your budget is tight and you need basic, interactive charts without extensive customization.
2. Highcharts
Need advanced visualizations and robust mobile support?
Highcharts makes more sense for complex visualizations, if you require a more extensive range of chart types, or if robust mobile responsiveness and a larger community are critical. What I found comparing options is that Highcharts offers comprehensive features for complex needs, though it can be more expensive than CanvasJS for single developers.
- 🎯 Bonus Resource: While discussing diverse business needs, protecting your information is critical. My Safetica Review explores data breach prevention using AI context.
Consider this alternative when your project demands extensive chart types, advanced features, and strong mobile support.
3. Google Charts
Looking for a free, easy-to-use solution already in the Google ecosystem?
Google Charts is a strong contender if you need a free solution, prioritize ease of use, and value its data discovery features. Alternative-wise, Google Charts simplifies integration within their ecosystem, but lacks the offline capabilities and advanced interactivity of CanvasJS.
Choose Google Charts for quick, free implementations, especially if you’re already leveraging Google’s other services.
4. D3.js
Developing highly customized and unique data visualizations?
D3.js is the preferred choice for developers who need to create unique, highly customized, and complex data visualizations that go beyond standard chart types. From my analysis, D3.js provides unparalleled control for bespoke charts, but comes with a steeper learning curve compared to CanvasJS.
Choose D3.js when your project requires extreme customization and you have the technical expertise for a lower-level API.
Quick Decision Guide
- Choose CanvasJS: High performance, extensive charts, and easy API for most needs
- Choose Chart.js: Free, lightweight, and simple interactivity for basic use
- Choose Highcharts: Advanced features, robust mobile, and vast chart options
- Choose Google Charts: Free, easy-to-use within Google’s ecosystem
- Choose D3.js: Ultimate customization for unique, complex visualizations
The best CanvasJS alternatives depend on your specific project requirements and technical skill level.
CanvasJS Setup
Is CanvasJS implementation a concern?
This CanvasJS review section dives into the practicalities of deployment, setup, and adoption, helping you understand what to expect. We’ll set realistic expectations for your implementation journey.
1. Setup Complexity & Timeline
Expect a straightforward path.
CanvasJS is designed for ease of use, making its implementation relatively simple for developers familiar with JavaScript. From my implementation analysis, most teams achieve basic setup quickly, often within days, due to its intuitive API and comprehensive documentation.
You’ll need to plan for basic integration efforts, but a lengthy project timeline is generally not required.
2. Technical Requirements & Integration
Minimal technical hurdles stand in your way.
Your setup requires a modern web browser and a basic understanding of JavaScript for integration into your existing web applications. What I found about deployment is that CanvasJS integrates easily with popular frameworks, avoiding complex server-side configurations or extensive hardware needs.
Plan for your development team to handle the JavaScript integration, but major IT infrastructure changes are unlikely.
- 🎯 Bonus Resource: If you’re also looking into automating tasks for your web projects, my article on data extraction without website layout failures covers the topic.
3. Training & Change Management
Adoption is intuitive, even for new developers.
The library’s intuitive learning curve means that even those new to data visualization can quickly create functional charts. From my analysis, the straightforward API reduces extensive training needs, allowing developers to become productive rapidly without a steep learning curve.
Expect your development team to pick up CanvasJS quickly, with minimal resistance, due to its developer-friendly design.
4. Support & Success Factors
Vendor support can smooth your journey.
CanvasJS offers comprehensive documentation and forum-based support, with commercial license holders receiving priority assistance. What I found about deployment is that timely support can prevent minor integration roadblocks, ensuring your implementation stays on track with minimal delays.
Plan to leverage their documentation and, for commercial users, their priority support to address any specific challenges efficiently.
Implementation Checklist
- Timeline: Days to a few weeks for core integration
- Team Size: 1-2 JavaScript developers for integration
- Budget: Primarily developer time, minimal external costs
- Technical: Basic JavaScript knowledge and modern browser support
- Success Factor: Clear data visualization requirements and skilled developers
The CanvasJS setup is remarkably accessible, promising quick deployment for most development teams seeking robust charting capabilities.
Bottom Line
Is CanvasJS the right charting solution for your needs?
My CanvasJS review provides a clear final assessment, guiding you through who benefits most from its features and why it might be the ideal choice for your data visualization projects.
1. Who This Works Best For
Developers needing high-performance web data visualization.
CanvasJS is ideal for developers and businesses building interactive web applications requiring fast, responsive charts for large datasets across various devices. From my user analysis, companies needing robust, customizable charting for dashboards will find immense value in its efficient rendering capabilities.
You’ll succeed if your project demands a strong balance of ease-of-use, performance, and cross-device compatibility for data display.
2. Overall Strengths
Exceptional performance with extensive customization options.
The software excels in delivering high-performance, interactive charts that handle thousands of data points without degradation, supported by a versatile API. From my comprehensive analysis, its HTML5 Canvas rendering ensures speed and efficiency, making it perfect for dynamic and real-time data monitoring within your applications.
These strengths mean your web applications will feature engaging, fluid data visualizations that enhance user experience and provide critical insights.
3. Key Limitations
Smaller community and less robust advanced interactivity.
While powerful, CanvasJS has a smaller community compared to open-source alternatives, potentially limiting community-driven resources and specialized tutorials. Based on this review, some users desiring highly complex or unique custom visualizations might find it less flexible than D3.js, which offers deeper customization.
I find these limitations are manageable for most standard business needs but become more apparent if you’re pushing the boundaries of chart interactivity.
4. Final Recommendation
CanvasJS is a strong recommendation for web visualization.
- 🎯 Bonus Resource: While we’re discussing data-driven insights, understanding how to protect your privacy and data is equally important for any online activity.
You should choose this software if you need a reliable, high-performance charting library for web applications, especially when prioritizing ease of use and efficient rendering. From my analysis, it balances robust features with a competitive price point, making it a compelling solution for a wide range of data visualization needs.
My confidence level is high for developers and businesses seeking a solid, performant, and customizable charting solution.
Bottom Line
- Verdict: Recommended
- Best For: Developers and businesses building interactive web applications
- Business Size: Startups to large enterprises across diverse industries
- Biggest Strength: High performance with large datasets and extensive customization
- Main Concern: Smaller community compared to some open-source alternatives
- Next Step: Explore the demo and documentation for your project
This CanvasJS review demonstrates strong value for web data visualization, especially for those prioritizing performance and ease of use in their charting solutions.


