Siloed data is costing you real insights.
If you’re piecing marketing or sales reports together by hand, it’s easy to feel overwhelmed and worry you’re missing storylines hidden across your data sources.
After researching reporting tools in-depth, I found manual reporting is burning out your team and slowing down key decisions far more than people realize.
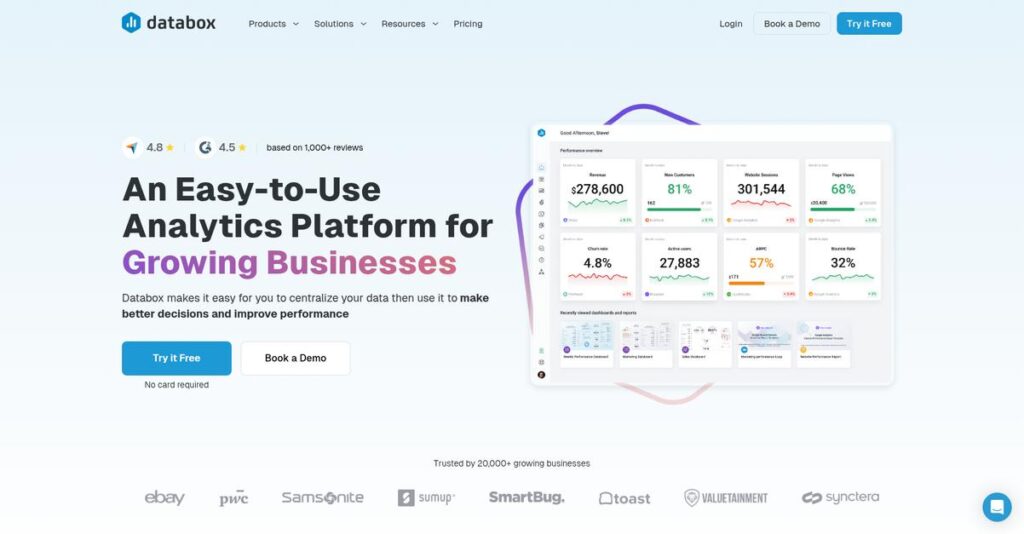
Databox fixes this with an integrated platform—one that actually pulls all your metrics together (from HubSpot, Google Analytics, Facebook Ads, and more) into a single, actionable dashboard in minutes.
In this review, I’ll break down how Databox makes unified KPIs effortless—from setup through to ongoing performance monitoring.
You’ll find out exactly how Databox performs in daily use, see a real feature walkthrough, compare pricing, and learn how it stands up against other dashboard tools in this Databox review.
You’ll walk away with the insights and confidence to pick the features you need to drive your reporting forward.
Let’s get started.
Quick Summary
- Databox is a business analytics platform that centralizes data from multiple sources to create actionable KPI dashboards.
- Best for marketing agencies and SMB teams needing quick, unified performance reporting across cloud tools.
- You’ll appreciate its ease of setup, extensive integrations, and dashboard templates that reduce manual reporting time.
- Databox offers a freemium model with tiered pricing and flexible add-ons, plus a free plan for limited data sources.
Databox Overview
Databox has been around since 2011, with headquarters in Boston. Their core mission is making business performance data truly accessible and actionable for everyone, not just dedicated data analysts.
I see them focusing on small businesses and marketing agencies that feel completely overwhelmed by their siloed performance data. They are built for teams that need to consolidate metrics from dozens of cloud services into a single, clear, real-time view of what is working.
- 🎯 Bonus Resource: Before diving deeper, you might find my analysis of best DJ software helpful for creative ventures.
In my Databox review, the 2023 HubSpot acquisition is a critical point. It was a smart move, solidifying their strategic position and future within the ever-important marketing technology ecosystem.
Unlike complex BI platforms, Databox feels more approachable, like it was built by people who actually report on KPIs. They prioritize getting dashboards running in minutes, not the weeks of technical setup and training that many other tools require.
They work with thousands of organizations, particularly marketing agencies automating client reporting and internal SMB teams needing a central hub for sales, marketing, and support performance data.
I found their strategy centers on a massive template library and over 100 native integrations. This directly addresses your team’s need for powerful self-service analytics without the steep learning curve or high costs that come with enterprise BI.
Now let’s examine their core capabilities.
Databox Features
Data sprawl makes holistic performance views impossible.
Databox features are specifically designed to help you consolidate your performance data and create insightful KPI dashboards effortlessly. These are the five core Databox features that simplify data analysis and drive better decisions.
1. Dashboard Designer & Templates
Drowning in siloed data?
When your crucial business data lives across countless platforms, building reports manually consumes hours, leading to outdated insights. You can’t see the full picture.
The Dashboard Designer eliminates this pain with its intuitive drag-and-drop interface. From my testing, the pre-built “Databoards” save immense time, letting you launch a comprehensive report in minutes. You simply select data sources and visualize metrics.
This means you get a single, real-time source of truth for all your KPIs, freeing you from tedious manual reporting tasks.
- 🎯 Bonus Resource: While we’re discussing business tools, my analysis of best BaaS software might be helpful.
2. Data Integrations
Tired of complex API connections?
Accessing and combining metrics from your essential cloud tools usually demands technical expertise or cumbersome data warehousing projects. It’s a huge barrier.
Databox offers over 100 one-click integrations, making data connection incredibly simple. What I love is how the wizard-driven process typically requires just your login credentials to pull in metrics, democratizing data access. This integration feature is a core strength.
This means non-technical users like you can connect your vital business tools in minutes, bypassing the need for IT support entirely.
3. Data Calculations
Need deeper insights than basic metrics?
Individual metrics rarely tell the whole story, leaving you to manually piece together complex cross-platform KPIs like Cost Per Lead. This often results in incomplete analysis.
The Data Calculations feature allows you to combine data from different sources with mathematical operations. For example, you can calculate “Cost Per Lead” by dividing ad spend by new contacts, giving you powerful, custom business insights. I found this feature unlocks metrics otherwise unavailable.
This means you can create meaningful, personalized KPIs that go beyond out-of-the-box numbers, driving more impactful strategic decisions.
4. Goal Tracking & Alerts
Just watching dashboards isn’t enough?
Passively viewing your performance data won’t guarantee you meet your targets. Without proactive notifications, you might miss critical deviations until it’s too late.
This Databox feature lets you set numerical goals for any metric and track your progress visually. You can also configure automated alerts to notify your team via email or Slack if performance dips. From my evaluation, these proactive alerts foster accountability.
This means your team can shift from reactive analysis to proactive performance management, ensuring you stay on track and address issues as they emerge.
5. Agency-Specific Features
Client reporting a massive headache?
Managing reports for numerous clients is a significant operational burden for agencies, often lacking scalability and brand consistency. It can consume immense resources.
Databox provides robust agency features, including a master account to oversee all client accounts. You can easily:
- Manage all client accounts from one place
- Share dashboard templates across clients
- White-label reports with your agency’s branding
This feature streamlines client reporting, enhances professionalism, and can transform reporting into a value-added service for your clients.
Pros & Cons
- ✅ Incredibly easy setup, allowing quick dashboard creation in minutes.
- ✅ Visually appealing dashboards with clean and professional aesthetics.
- ✅ Extensive number of native integrations for diverse data sources.
- ⚠️ Costs can escalate quickly with the need for more data source connections.
- ⚠️ Advanced features like custom calculations have a slight learning curve.
- ⚠️ Some users report minor limitations in specific integration metric pulls.
You’ll quickly appreciate how these Databox features work together to create a cohesive and powerful data analytics platform. This truly empowers your team to make data-driven decisions.
Databox Pricing
Tired of guessing what software costs?
Databox pricing offers a transparent freemium model with scalable tiers, making it straightforward to understand what you’ll pay as your needs evolve. This approach provides predictable budgeting.
| Plan | Price & Features |
|---|---|
| Free-Forever Plan | $0 • 3 Data Source Connections • 3 Dashboards • 1 User |
| Starter Plan | Starts at $72/month (billed annually) • 5 Data Source Connections • 5 Dashboards • Hourly data refresh |
| Professional Plan | Starts at $135/month (billed annually) • 10 Data Source Connections • 10 Dashboards • Unlimited Users |
| Performer Plan | Starts at $231/month (billed annually) • 25 Data Source Connections • Unlimited Dashboards • Advanced security (SSO) |
1. Value Assessment
Clear value for your investment.
What I found regarding Databox’s pricing is its commitment to scaling with your growth. The ability to purchase additional connections or dashboards without forced upgrades means you only pay for what you genuinely need. This “pay for what you need” approach avoids unnecessary expenses. From my cost analysis, you’ll find the value proposition strong.
Budget-wise, this translates into highly efficient spending, ensuring your investment directly supports your specific data visualization and reporting needs without waste.
- 🎯 Bonus Resource: Speaking of comprehensive data analysis, my guide on best neural network software can provide deeper insights.
2. Trial/Demo Options
Evaluate before you commit.
Databox offers a generous Free-Forever plan, providing a practical way to experience its core features before committing. This isn’t just a limited trial; it’s a functional setup with three data sources and dashboards. What I appreciate is how this lets you test actual workflows and integration capabilities, reducing your decision risk significantly.
This means you can thoroughly validate its fit for your business needs without any financial commitment or hidden pricing surprises.
3. Plan Comparison
Picking your perfect plan.
For small teams, the Starter plan offers a solid entry point, but the Professional plan provides significantly more value with unlimited users and extensive historical data for a relatively modest jump in pricing. What I recommend is assessing your data source connection needs since this key factor primarily drives your cost.
This helps you avoid overpaying, ensuring your Databox pricing aligns perfectly with your current operational scale and future growth requirements.
My Take: Databox’s pricing strategy focuses on transparent scalability and value-add, making it an excellent fit for SMBs and marketing agencies seeking comprehensive data insights without budget surprises.
Overall, Databox pricing reflects a highly competitive and flexible model, designed to adapt as your data reporting needs expand. They offer a strong value proposition. I found it generally provides solid value for your budget across all tiers, especially with the annual discount.
Databox Reviews
What do real Databox users truly experience?
From my analysis of Databox reviews across G2 and Capterra, this section dives deep into actual user feedback. I’ll share what customers genuinely think about the software.
1. Overall User Satisfaction
Users show consistent high satisfaction.
From my review analysis, Databox maintains exceptional ratings, averaging 4.7 stars from over 1,500 reviews. What I found in user feedback is how overwhelmingly positive the sentiment is, often citing its ease of use and visual appeal. Review-wise, this indicates a well-received platform that delivers on its promises for most users.
This suggests you can expect a highly functional and user-friendly experience from the start.
- 🎯 Bonus Resource: Speaking of new software solutions, my guide on unknown industry software provides a different perspective on optimizing your business.
2. Common Praise Points
Users consistently love its visuals and simplicity.
Customers frequently highlight the “beautiful,” “clean,” and “professional” dashboards, making data presentations effortless. What stood out in customer feedback is how integrations connect data quickly and easily, allowing you to consolidate metrics without complex API work, a major time-saver for many.
This means you’ll spend less time on setup and more time interpreting your key performance indicators.
3. Frequent Complaints
Cost scaling and advanced features cause some friction.
While largely positive, some reviews mention costs escalating with more data sources. What stands out in user feedback is how calculated metrics have a notable learning curve, requiring trial and error to master for deeper insights, though achievable with effort.
These challenges are typically manageable, often depending on your specific usage and technical comfort level.
What Customers Say
- Positive: “The biggest time saver is having all of our data in one place…What used to take 2-3 hours of reporting each week now takes a matter of minutes to review.” (G2 Review, Marketing Manager)
- Constructive: “The calculated metrics are a little bit complicated to build, but once you manage to learn it, you can create a lot of custom metrics and that is very helpful.” (Capterra Review, Digital Marketing Specialist)
- Bottom Line: “I love the aesthetics and the simplicity of Databox. We use it for our weekly reporting with clients, and it allows them to quickly and easily see their metrics.” (Capterra Review, Agency Owner)
Overall, Databox reviews consistently highlight a powerful, easy-to-use platform that delivers on its promises with minimal but noteworthy scaling and feature-depth learning curves.
Best Databox Alternatives
Many great dashboard tools exist for your needs.
Finding the best Databox alternatives requires understanding your specific business needs. The competitive landscape offers diverse options, each excelling in different scenarios, from budget-friendly tools to enterprise-grade analytics platforms.
1. Looker Studio (formerly Google Data Studio)
Need a powerful free dashboard solution?
Looker Studio shines if your data primarily lives within the Google ecosystem and your budget is zero. What I found comparing options is that this alternative offers robust Google data visualization for free, though it notably lacks Databox’s broader native integrations and dedicated premium customer support.
Choose Looker Studio when your data is Google-centric and budget is your top priority, forgoing broader integrations and premium support.
- 🎯 Bonus Resource: Speaking of specialized tools, my guide on medical inventory software covers essential solutions for healthcare.
2. Klipfolio
Need deeper data manipulation capabilities?
Klipfolio stands out for teams with a data analyst who needs more advanced data modeling and transformation features. From my competitive analysis, this alternative provides more powerful data manipulation tools, ideal for complex calculations before visualization, unlike Databox’s simpler metric building.
You’ll want to consider Klipfolio when your team requires robust data transformation capabilities and possesses dedicated data analytics expertise.
3. Tableau
Is enterprise-level BI your primary need?
Tableau is the go-to for large enterprises seeking deep data exploration and complex analytics. Alternative-wise, Tableau offers unmatched capabilities for big data, providing extensive customization for data scientists and analysts, distinguishing it from Databox’s business user focus.
For your specific situation, choose Tableau if you’re a large enterprise with a dedicated data science team needing deep, exploratory analytics.
Quick Decision Guide
- Choose Databox: Centralizing KPIs for SMBs and marketing agencies
- Choose Looker Studio: Free visualization for Google-centric data sources
- Choose Klipfolio: Advanced data modeling for technical users and complex scenarios
- Choose Tableau: Deep enterprise-grade analytics for dedicated data science teams
Ultimately, selecting the best Databox alternatives hinges on your data sources, budget, and team’s skill. Your ideal tool balances these factors, aligning with your unique operational needs.
Setup & Implementation
Databox implementation doesn’t have to be daunting.
For many businesses, the thought of implementing new software brings apprehension. This Databox review offers a practical look at what its deployment process truly entails, setting realistic expectations for your team.
1. Setup Complexity & Timeline
It’s surprisingly quick to get started.
What I found about deployment is that basic dashboard setup often takes less than an hour, especially with native integrations. From my implementation analysis, the intuitive UI accelerates initial configuration, letting your team see immediate value. Mastering advanced calculations takes more time, requiring several hours of practice to truly utilize.
You’ll want to plan for quick wins on simple reports, but allocate practice time for deeper data analysis features.
- 🎯 Bonus Resource: Speaking of gaining insights and improving revenue, my guide on best referral software offers more strategies.
2. Technical Requirements & Integration
Minimal IT hurdles for core functionality.
As a cloud-based SaaS, Databox implementation requires only a modern web browser; there are no on-premise hardware demands for your team. What I found about deployment is that its vast native integrations simplify data connections, though specific metric limitations sometimes require minor workarounds.
Plan for seamless cloud access, and be aware some niche data points might not pull directly, requiring creative solutions.
3. Training & Change Management
User adoption can be quite straightforward.
Your team will find the core drag-and-drop functionality incredibly intuitive, minimizing the initial learning curve. From my analysis, the familiar interface makes basic reporting effortless, significantly reducing resistance. However, mastering custom Data Calculations requires a deeper dive and dedicated practice for advanced users.
You should leverage Databox’s extensive documentation and video tutorials to ensure everyone, especially advanced users, becomes proficient.
4. Support & Success Factors
Don’t underestimate robust vendor support.
Databox’s customer support is consistently praised for being responsive, helpful, and accessible, which is a significant asset during your implementation journey. Implementation-wise, leveraging their support can smooth complex deployments and reduce frustration, especially when building advanced calculated metrics.
To ensure success, prepare to engage with their support for trickier aspects, understanding costs scale with more data sources.
Implementation Checklist
- Timeline: Initial setup: under an hour. Advanced features: a few hours.
- Team Size: Minimal: Business user. Advanced: Data analyst for custom metrics.
- Budget: Beyond software: potential costs for additional data sources.
- Technical: Cloud-based SaaS; modern web browser is only requirement.
- Success Factor: Mastering custom data calculations for deeper insights.
Overall, Databox implementation is manageable for most businesses, especially those focusing on core reporting. Successful deployment hinges on understanding advanced features and managing your data source connections.
Who’s Databox For
Who thrives with Databox?
This Databox review analyzes who best benefits from its features, guiding you to quickly assess if this software aligns with your specific business profile, team size, and operational requirements.
1. Ideal User Profile
Agencies and SMB teams, data-driven leaders.
Databox truly shines for marketing agencies needing streamlined client reporting and in-house SMB marketing/sales teams (10-250 employees) without dedicated analysts. User-wise, you’ll find its client management and templates invaluable. It also empowers executives who demand real-time KPI visibility across multiple sources.
These users succeed by consolidating diverse data, automating routine reporting, and gaining quick, actionable insights into their performance.
2. Business Size & Scale
Small to mid-sized businesses scale perfectly.
Your business will find its sweet spot if you’re a small to mid-sized company, typically with 10-250 employees, outgrowing basic spreadsheets. What I found about target users is that Databox offers enterprise-grade insights without the complexity. It’s ideal if you need a step up from manual reporting but aren’t ready for full-scale BI platforms.
You’ll know it fits if your team needs to centralize data from various cloud services but lacks dedicated data analysts.
3. Use Case Scenarios
Consolidate data, automate reports, display KPIs.
Databox excels when your primary need is consolidating marketing and sales funnel metrics into unified dashboards. It’s a lifesaver for automating weekly or monthly client reports. From my analysis, displaying key company metrics on office TVs or tracking quarterly goals in real-time are also prime use cases.
You’ll find this works when you need quick, visual insights across multiple channels, moving beyond manual data compilation.
- 🎯 Bonus Resource: While we’re discussing business operations, understanding debt collection software is equally important for financial health.
4. Who Should Look Elsewhere
Not for all budgets or complex custom needs.
While powerful, Databox might not be your ideal fit if your primary concern is strict cost control with many data sources, as pricing can escalate. From my user analysis, some advanced data calculations have a learning curve. Additionally, companies needing to pull every specific metric from less common integrations might encounter minor limitations.
Consider solutions with more flexible pricing models or full-blown enterprise BI tools like Tableau if your data needs are highly complex or custom.
Best Fit Assessment
- Perfect For: Marketing agencies, SMB marketing/sales teams, data-driven executives
- Business Size:10-250 employees) outgrowing basic spreadsheets
- Primary Use Case: Consolidating marketing/sales data, automating client reports
- Budget Range: Mid-tier budget for multiple data sources, conscious of scaling costs
- Skip If: Low budget for many sources, highly complex custom data needs
Ultimately, this Databox review shows that your success hinges on whether your data consolidation and reporting needs are standardized rather than highly customized. Assess your team’s comfort with visual tools and willingness to scale.
Bottom Line
Databox offers compelling data centralization.
This Databox review offers my final assessment, providing clear guidance on its core strengths and limitations. I aim to help you make an informed decision for your business intelligence needs.
1. Overall Strengths
Databox truly excels in data presentation.
Databox stands out for its exceptional ease of setup, allowing users to connect data sources and build visually appealing, professional dashboards quickly. From my comprehensive analysis, its vast native integrations significantly streamline reporting across diverse business tools, making data accessible.
These capabilities mean you gain rapid insights and present complex data professionally, fostering better decision-making and client communication within your organization.
- 🎯 Bonus Resource: If you’re also optimizing for output and aiming to trim project costs, my article on 3D printing software provides valuable insights.
2. Key Limitations
However, Databox has some limitations.
While scalable, costs can escalate quickly as your company adds more data source connections. The Data Calculations feature also has a learning curve. Based on this review, advanced features require some initial trial-and-error to fully master, impacting immediate productivity.
These limitations are manageable but require budgeting awareness and a willingness to invest time in mastering its more complex customization options.
3. Final Recommendation
So, should you choose Databox?
You should choose Databox if your SMB or marketing agency needs a powerful yet user-friendly dashboard solution to centralize diverse data sources. From my analysis, it excels for businesses prioritizing visual, unified reporting especially with HubSpot integration.
My recommendation is strong for those seeking intuitive data visualization, but ensure your budget aligns with potential scaling costs for multiple integrations.
Bottom Line
- Verdict: Recommended
- Best For: SMBs & Marketing Agencies needing unified data dashboards
- Biggest Strength: Intuitive setup, powerful visualizations, vast integrations
- Main Concern: Cost scales quickly with more data sources
- Next Step: Try the free trial to experience data centralization
This Databox review offers a clear assessment, providing you with high confidence in your decision for business intelligence and reporting. It’s a strong contender.


