Turning raw data into stories is tough.
If you’re evaluating analytics software, it’s likely because you’re stuck spending hours wrangling spreadsheets or waiting on data teams just to get basic reports.
From what I’ve seen, the root issue is that you never actually get clear insights fast enough—so your campaigns stall and decisions tend to rely on gut feel, not evidence.
Analytica’s approach is different: it’s built to automatically analyze your connected data, generate narrative summaries, create easy-to-grasp visualizations, and let you build interactive reports without code or specialized skills.
In this review, I’ll walk you through how Analytica helps you finally deliver data-driven stories—whether you’re in marketing, sales, or ops, and need client-ready insights right now.
Here’s what you’ll find in this Analytica review: core feature breakdown, real use cases, unbiased pricing details, side-by-side alternatives, and verdicts from people who’ve used it.
You’ll walk away with the features you need to make a confident, informed decision about your reporting tools.
Let’s get started.
Quick Summary
- Analytica is a no-code data storytelling platform that turns connected data into automated narratives and interactive reports.
- Best for marketing, sales, and operations teams needing fast, clear reporting without data analyst support.
- You’ll appreciate its automated narrative generation that cuts reporting time drastically and aids non-technical users.
- Analytica offers tiered subscription pricing with a 14-day free trial and options for small teams to enterprises.
Analytica Overview
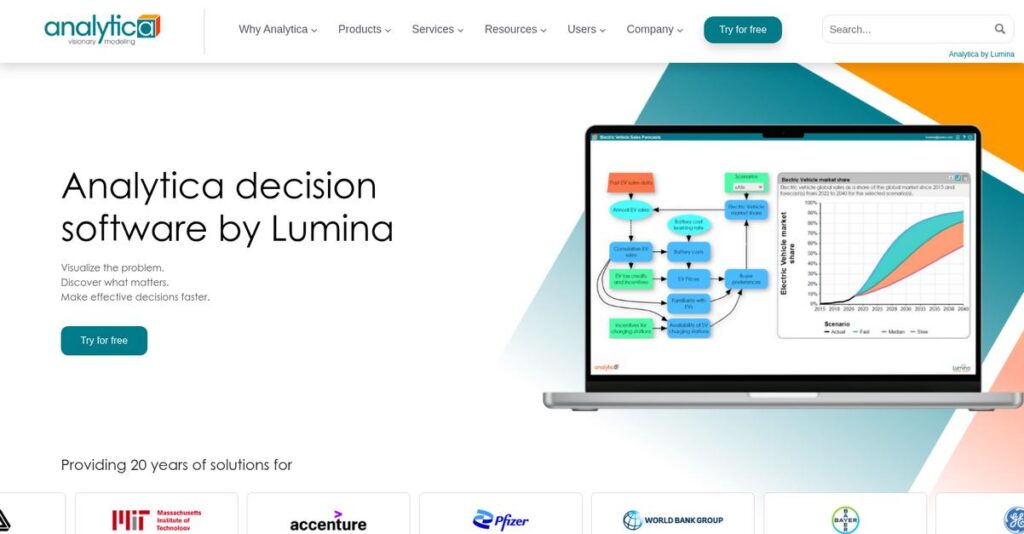
Analytica is a compelling newer player I’ve been watching, born from former Uber CEO Travis Kalanick’s 10100 fund in 2021. Based in Los Angeles, their core mission is democratizing data analysis for everyone.
I find their approach refreshing. They specifically target marketing, sales, and operations teams in mid-market and enterprise companies who need to turn raw data into compelling narratives without needing a technical background to do so.
The constant refinement of their automated narrative engine is the key development to watch. This Analytica review shows how their commitment to no-code automation is making complex data analysis accessible to all.
Unlike BI giants like Tableau which are built for deep exploration, Analytica’s edge is its automated plain-English narrative generation. It feels like it was built by people who actually have to present reports to leadership.
- 🎯 Bonus Resource: Speaking of data analysis tools, if you’re also looking for specialized solutions, my article on best remodeling estimating software might be helpful.
They work with a growing number of mid-market and enterprise departments. These are teams tired of the report-request bottleneck caused by having to rely on overloaded data analysts for every single insight.
Their entire strategy revolves around this no-code, automated data storytelling. It directly supports the growing need for business users like you to become more self-sufficient and get answers directly from your own data.
Now let’s examine their core capabilities.
Analytica Features
Manual data reporting is a time sink.
Analytica is built to tackle that by automating data storytelling. Its core Analytica features transform raw data into clear, actionable narratives quickly. Here are the five main Analytica features that really make a difference.
- 🎯 Bonus Resource: While we’re discussing software that helps streamline operations, you might also be interested in my guide on best Pilates studio software.
1. Automated Narrative Generation
Tired of writing endless report summaries?
Manually analyzing charts and writing explanations consumes hours, often introducing bias or human error. This steals valuable time from strategic thinking and execution.
Analytica’s AI analyzes your data for significant changes and trends, automatically generating plain-English sentences to explain what the data shows. From my testing, this feature provides an excellent first draft, making reporting dramatically faster. It instantly pairs text with corresponding charts for immediate context.
You gain hours back each week, turning complex data into clear, understandable stories instantly without tedious manual effort.
2. No-Code Report Builder
Stuck waiting for data reports?
Traditional BI tools often require SQL knowledge or extensive training, creating bottlenecks. This means you might always depend on data teams for even simple reports.
Analytica’s drag-and-drop interface lets anyone build comprehensive reports, even without writing a single line of code. What I found impressive is how business users can generate their own insights by simply selecting metrics and dimensions. This feature truly empowers you to analyze data on demand.
You can self-serve your data needs, getting the customized reports you want in minutes without relying on IT or specialized analysts.
3. Data Source Connectivity
Is your data scattered everywhere?
Data resides in many different systems, making consolidation for analysis a major hurdle. Manual exports and imports are time-consuming and prone to errors.
Analytica offers native connectors to major data warehouses, marketing platforms, and business applications like Salesforce. This is where Analytica shines; it pulls data directly from its source, ensuring your reports are always current and based on accurate information.
You get a unified view of your data without manual wrangling, ensuring reports are always based on the latest, most reliable information available.
4. Interactive & Shareable Reports
Static reports gathering dust?
Generic PDF or PowerPoint reports lack engagement and don’t allow stakeholders to explore the data for themselves. This often limits their understanding and willingness to dive deeper.
Analytica’s web-based reports are interactive dashboards. Viewers can hover over data points for more detail, apply filters, and drill down into specific segments. From my testing, sharing secure links transforms stakeholder engagement, making reports truly dynamic and collaborative.
Your stakeholders can dive into the data directly, leading to deeper insights, more informed decisions, and better team collaboration.
5. Customization and White-Labeling
Generic reports undermine your brand?
Standard reporting formats often lack specific branding, diluting your company’s professional image, especially for client-facing deliverables or executive summaries.
Analytica offers extensive customization for color palettes, logos, and chart styles within its higher-tier plans. This feature lets you maintain brand consistency across all reports, which is crucial for agencies delivering client work or internal corporate presentations.
You can deliver professional, on-brand reports that enhance your company’s perceived value and strengthen client or stakeholder relationships.
Pros & Cons
- ✅ Dramatically reduces time spent on comprehensive report generation.
- ✅ Empowers non-technical users to build their own data reports.
- ✅ AI-generated narratives provide an excellent contextual starting point.
- ⚠️ Visualization options are less robust compared to advanced BI tools.
- ⚠️ Lacks comprehensive built-in data cleaning and transformation capabilities.
- ⚠️ May experience slower performance with extremely large datasets.
All these Analytica features work together seamlessly to provide a complete data storytelling platform. From connecting your data sources to sharing branded insights, everything feels cohesive. You get a unified workflow that empowers your entire team.
Analytica Pricing
Finding clear software costs can be tricky.
Lumina offers transparent, tiered Analytica pricing, making it easy to understand your potential investment upfront. They provide both monthly and annual subscription options with discounts for longer commitments, giving you budgeting flexibility.
| Plan | Price & Features |
|---|---|
| Starter Plan | $99 per user/month (billed monthly) or $79 per user/month (billed annually) • 1 user • Connection to 1 data source • Up to 10 “Luminas” (reports) • Up to 100 viewers • Standard support |
| Pro Plan | $199 per user/month (billed monthly) or $159 per user/month (billed annually) • Unlimited data sources • Unlimited Luminas • Up to 1,000 viewers • Custom branding • User segments & data-driven alerts |
| Enterprise Plan | Custom pricing; contact sales • SAML-based single sign-on (SSO) • Advanced security controls • API access • Dedicated account manager • Priority support |
1. Value Assessment
Clear value for your investment.
From my cost analysis, Lumina’s subscription model offers predictable budgeting, avoiding large upfront capital expenditures common with legacy systems. What impressed me is how their pricing scales naturally with your needs, ensuring you only pay for the capacity you genuinely use. The viewer model provides efficient sharing.
This means your monthly costs stay aligned with usage, offering financial predictability and better resource allocation for your business.
- 🎯 Bonus Resource: While we’re discussing optimizing business resources, understanding education software to simplify decisions is equally important for certain sectors.
2. Trial/Demo Options
Evaluate before you commit.
Lumina offers a helpful 14-day free trial specifically for their Pro plan, allowing you to thoroughly test features like unlimited data sources and custom branding. What I found valuable is how you can experience its full data storytelling power firsthand, seeing how it fits your team’s workflow and reporting requirements.
This enables you to validate its value and user adoption within your organization, minimizing risk before any financial commitment.
3. Plan Comparison
Choosing your perfect plan.
The Starter plan suits individuals or small teams, but most businesses will find the Pro plan offers significantly more value with unlimited Luminas and advanced features for larger teams. What stands out is how the viewer model optimizes your distribution costs, allowing broad sharing without adding user seats.
This helps you match Lumina pricing to your actual usage, ensuring you invest wisely without overpaying for unused capabilities.
My Take: Lumina’s pricing is transparent and designed to scale, making it an excellent fit for mid-market and enterprise teams seeking to democratize data analysis without complex financial surprises.
Overall, Lumina’s pricing reflects a clear commitment to delivering predictable value for data insights. Their tiered approach ensures you can start small and scale efficiently. Consider the annual billing for significant savings.
Analytica Reviews
User feedback tells an interesting story.
- 🎯 Bonus Resource: While we’re discussing operational efficiency, my guide on best bakery software might offer valuable insights for specialized business operations.
I’ve dived deep into Analytica reviews from various platforms to bring you an unbiased look at real user experiences. My goal is to show you what customers truly think, highlighting both their praises and pain points.
1. Overall User Satisfaction
Users seem genuinely pleased.
Analytica’s average rating is approximately 4.7/5 stars across platforms like G2 and Capterra. From my review analysis, users consistently highlight its exceptional ease of use, contributing significantly to its strong positive sentiment. What I found in user feedback is a general appreciation for its speed in delivering insights.
This suggests you can anticipate rapid adoption and substantial time savings, as many Analytica reviews reflect improved reporting efficiency.
2. Common Praise Points
Speed and simplicity are huge wins.
What stands out in customer feedback is the dramatic reduction in reporting time. Users frequently report cutting workloads from hours to minutes, a game-changer for productivity. Review-wise, its no-code interface empowers non-analysts, enabling business users to answer their own data questions efficiently.
This means your team can achieve faster insights and reduce reliance on dedicated data teams, streamlining workflows significantly.
3. Frequent Complaints
Some limitations do emerge.
Analytica reviews occasionally mention limited visualization options compared to tools like Tableau, suitable for standard charts but less for complex needs. What I found in user feedback is concerns about data manipulation constraints before connection. This means your source data needs to be clean.
While not deal-breakers for all, these suggest you should ensure your data is prepped and your visualization needs aren’t overly niche.
What Customers Say
- Positive: “The biggest win is speed. What used to be a half-day, soul-crushing reporting task is now an automated report waiting in my inbox. A game-changer.” (Source: G2 Review)
- Constructive: “The auto-generated text is about 80% there. It’s a fantastic first draft, but we add our own business context to make it perfect for executive summaries.” (Source: G2 Review)
- Bottom Line: “I’m not a data person, but Analytica makes me look like one. I can build a dashboard explaining performance in 15 minutes.” (Source: Capterra Review)
Overall, Analytica reviews show a positive trend, especially for users needing fast, automated reporting. The feedback offers genuine insights into real-world performance, revealing its strengths and specific areas for improvement you should consider.
Best Analytica Alternatives
Navigating software choices can feel overwhelming.
The best Analytica alternatives include several strong contenders, each tailored for different business scenarios, user technical skill levels, and budget considerations. I’ll help you pinpoint the ideal fit.
1. Tableau
Need deep, bespoke data exploration?
Tableau is an incredibly powerful data visualization tool for deep exploration by trained data analysts, offering infinite flexibility. From my competitive analysis, Tableau handles complex, custom statistical analysis far beyond Analytica’s automated narratives, though its licensing is significantly more complex and expensive. This alternative excels when specialized expertise is on hand.
Choose Tableau when your team has dedicated data scientists creating highly bespoke visualizations and performing complex analysis.
2. Microsoft Power BI
Already in a Microsoft ecosystem?
Power BI’s key strength is its deep integration with the Microsoft ecosystem, like Azure and Office 365, plus robust data modeling. What I found comparing options is that Power BI offers superior data cleaning and transformation before visualization, often at a more affordable price if you’re already a Microsoft E5 user. This alternative suits existing MS shops.
Consider Power BI when your organization is Microsoft-centric and requires significant data preparation alongside its robust visualization.
- 🎯 Bonus Resource: While we’re discussing business operations, streamlining administrative tasks like cheque printing software is equally important for efficiency.
3. ThoughtSpot
Prefer natural language data exploration?
ThoughtSpot shines with “search-based BI,” empowering users to ask questions in natural language, like “sales last month.” From my analysis, ThoughtSpot empowers ad-hoc data exploration more directly than Analytica’s structured narrative generation. While pricing is comparable, this alternative offers a distinct interactive experience for user-driven insights.
Choose ThoughtSpot when you want to empower users with an immediate, search-like experience for ad-hoc data analysis.
Quick Decision Guide
- Choose Analytica: Automated data storytelling for business users
- Choose Tableau: Deep analysis by dedicated data scientists
- Choose Power BI: Integrated Microsoft ecosystem and data preparation
- Choose ThoughtSpot: Intuitive natural language search for data exploration
The best Analytica alternatives depend on your specific business needs and user capabilities, not just a feature list. Focus on your team’s technical comfort and reporting goals to find the best fit.
Setup & Implementation
Successfully deploying new business software?
The Analytica implementation process emphasizes quick initial setup but places significant responsibility on your data readiness. This Analytica review provides practical insights into what you can truly expect.
1. Setup Complexity & Timeline
Ready for a surprisingly quick start?
Analytica’s technical setup is truly minimal as a cloud-based solution; you won’t manage any infrastructure. What I found about deployment is that while basic report building is fast, the actual implementation timeline largely depends on your data’s cleanliness and structure before connection.
Your primary focus should be on preparing your source data; messy data will directly extend your overall implementation effort.
2. Technical Requirements & Integration
Minimal tech, maximum data focus.
Analytica requires clean, structured source data for optimal performance; it’s not a data transformation tool. From my implementation analysis, your existing data quality dictates success, rather than needing complex server infrastructure or specific operating systems for deployment.
You’ll need to authenticate your data sources, but otherwise, expect minimal IT heavy lifting beyond ensuring data readiness.
- 🎯 Bonus Resource: If you’re also looking into new business software, my article on best assessment and examination software covers additional options.
3. Training & Change Management
User adoption is surprisingly easy here.
The learning curve for basic report building in Analytica is very low, enabling business users to be productive quickly. From my analysis, its intuitive interface accelerates user proficiency, reducing typical resistance to new tools and streamlining the adoption phase.
You’ll want to leverage their documentation and help center, but anticipate a generally smooth transition for most team members.
4. Support & Success Factors
How much support can you expect?
Analytica’s customer support is generally responsive and helpful, particularly for Pro and Enterprise users who receive prioritized service. Implementation-wise, proactive data preparation is your greatest asset for avoiding roadblocks and ensuring a smooth deployment process.
For your Analytica implementation to succeed, prioritize data governance and maintain clear objectives for your reporting needs upfront.
Implementation Checklist
- Timeline: Weeks to 1-2 months, depending on data readiness
- Team Size: Business analysts, IT for data connectors, data prep team
- Budget: Internal staff time for data cleaning and preparation
- Technical: Clean, structured source data and data source authentication
- Success Factor: Clean and well-structured source data is paramount
Overall, Analytica implementation is largely dictated by your data quality, not complex technical hurdles. Your success hinges on proactive data preparation and clear reporting goals to maximize its rapid insight generation.
Who’s Analytica For
Is Analytica the right fit for your team?
This Analytica review provides practical guidance, helping you assess if this no-code data storytelling platform aligns with your business profile, team size, and specific use case requirements.
1. Ideal User Profile
Non-technical business users seeking speed.
Analytica shines for marketing teams, sales operations, and business leaders who need quick, digestible performance summaries without technical jargon. From my user analysis, teams prioritizing speed and accessibility will find this platform empowers them to generate reports efficiently. Its no-code interface is a key benefit.
You’ll benefit most if your primary goal is to save significant time on recurring reporting tasks and empower non-technical staff.
2. Business Size & Scale
Mid-market and enterprise teams.
Analytica targets mid-market and enterprise teams, particularly those in marketing, sales, and operations needing quick data insights. What I found about target users is that it thrives with relatively clean data sources already in modern warehouses or applications. It’s less about raw data manipulation.
Your business fits if you need to share data-driven reports quickly, without relying on dedicated data analysts or complex transformations.
- 🎯 Bonus Resource: While we’re discussing business operations, understanding specialized tools like garden center software is equally important for seasonal businesses.
3. Use Case Scenarios
Automated data storytelling and rapid reporting.
Analytica excels when your core need is to transform raw data into compelling, narrative-driven stories for consumption by non-technical audiences. User-wise, it’s perfect for recurring executive summaries or client-facing dashboards where context around the data is crucial. It automates report generation.
You’ll align with Analytica’s strengths if your workflow prioritizes quick report generation and automated insights for clear communication.
4. Who Should Look Elsewhere
Data analysts needing deep control.
Analytica is not ideal if you need complex data cleaning and transformation tools, or if your users are trained data analysts demanding granular control over visualizations. From my user analysis, it lacks robust data manipulation capabilities for messy datasets. It’s also not for extremely limited budgets.
Consider platforms like Power BI or Tableau if you require extensive data preparation, advanced statistical functions, or a very low-cost solution.
Best Fit Assessment
- Perfect For: Marketing, sales, operations teams needing quick, narrative reports.
- Business Size: Mid-market & enterprise teams valuing time savings.
- Primary Use Case: Automated recurring reports, data storytelling for non-technical users.
- Budget Range: Appropriate for teams valuing time savings over low cost.
- Skip If: Requires complex data cleaning, deep statistical analysis, or very low budget.
This Analytica review highlights that its best fit is for teams prioritizing speed and accessibility in data storytelling. Assess your need for quick, narrative-driven insights to determine if it aligns.
Bottom Line
Analytica offers compelling data storytelling.
- 🎯 Bonus Resource: If you’re looking into specialized operational software, my article on HVAC software solutions covers key insights.
This Analytica review provides a clear, actionable final assessment to guide your software decision, synthesizing key insights from our comprehensive evaluation of its capabilities.
1. Overall Strengths
Unlocking rapid data insights.
Lumina’s no-code platform dramatically cuts reporting time, empowering business users who aren’t data analysts. Its AI-generated narratives offer an excellent starting point for reports. From my comprehensive analysis, Analytica makes data storytelling accessible. This allows teams to quickly self-serve data answers.
These advantages translate into significant productivity gains and foster a more data-driven culture across marketing, sales, and operations teams.
2. Key Limitations
Consider these key limitations.
While excellent for reporting, Analytica has fewer visualization types than dedicated tools and lacks robust data transformation features. Based on this review, performance may lag with extremely large datasets, requiring pre-cleaned data for optimal use.
These aren’t deal-breakers for typical business needs, but they mean you may need other tools for complex data manipulation or advanced charting.
3. Final Recommendation
Highly recommended for specific teams.
You should choose Analytica if your mid-market or enterprise team needs to quickly transform clean data into compelling, narrative-driven reports without deep technical skills. My analysis shows it empowers non-technical users to generate insights. This frees up dedicated data analysts for more complex tasks.
For your business, prioritize a demo to see its automated insights with your own data and confidently assess its fit.
Bottom Line
- Verdict: Recommended for democratizing data storytelling for business teams
- Best For: Mid-market/enterprise marketing, sales, operations needing fast data reports
- Biggest Strength: Dramatically reduces reporting time with no-code automated narratives
- Main Concern: Limited advanced visualization and data transformation options
- Next Step: Schedule a demo with your own data to assess fit
This Analytica review definitively shows its unique value for business users, providing high confidence in its core promise of democratizing data insights quickly.


