Transforming static data into insights shouldn’t be this hard.
If you’re searching for ways to move your analytics beyond basic charts, you know how tough it is to deploy interactive data apps without lots of backend hassle.
But let’s be real: wasting hours wrangling code just to share one dashboard gets old—especially when you need your data to actually drive decisions today.
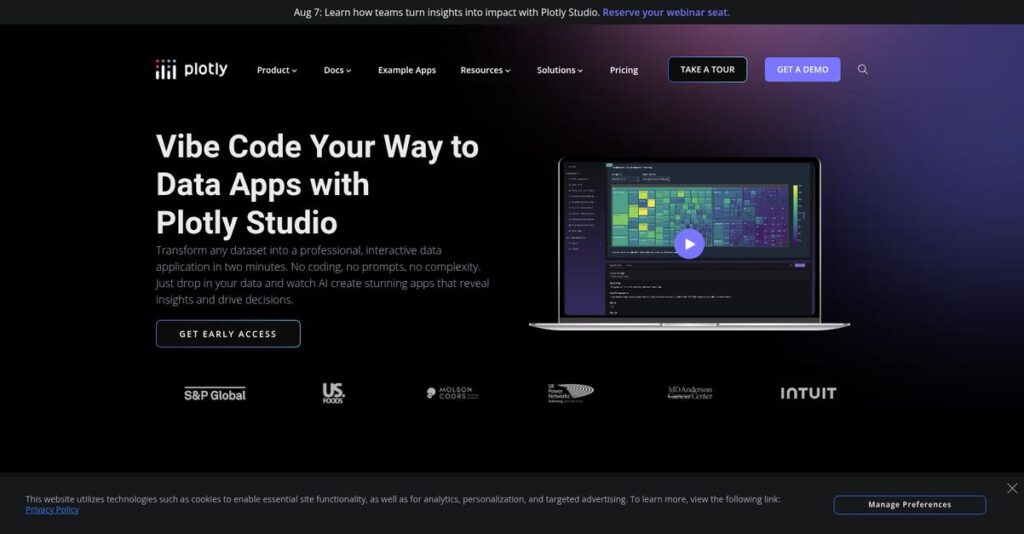
That’s exactly where Plotly steps in, letting you create, share, and scale interactive data applications without a heavy lift or a steep learning curve. From Dash Enterprise’s robust deployment tools to App Studio’s notebook-to-app magic, Plotly brings efficiency and polish to analytics workflows.
In this full review, I’ll break down how Plotly can actually cut your visualization build time while raising the quality of analytics you share.
Here’s what you’ll find in this Plotly review: an in-depth look at features, real-world use cases, pricing, what sets Plotly apart, and clear head-to-head comparisons if you’re weighing alternatives.
You’ll come away knowing exactly the features you need to pick the best platform for interactive analytics in 2025.
Let’s get started.
Quick Summary
- Plotly is a data visualization and analytics platform that enables building interactive, customizable web-based data applications.
- Best for data scientists and Python developers needing flexible, code-driven dashboards and analytics apps.
- You’ll appreciate its ability to create rich interactive visualizations and operationalize Python analytics without heavy front-end coding.
- Plotly offers free open-source libraries plus custom enterprise pricing with a 14-day free trial for Dash Enterprise.
Plotly Overview
Plotly has been around since 2012, based in Montreal, Canada. I find their core mission is refreshingly direct: helping enterprises build and scale modern data applications.
What really sets them apart is their deep, strategic focus on enterprise teams using Python analytics. They are not trying to be a general BI tool for everyone, instead specializing in helping your data scientists turn complex code-based analyses into polished, interactive business applications.
The recent launch of Plotly App Studio was a smart move. It helps streamline tricky notebook-to-app workflows, an area I’ll explore in detail through this Plotly review.
Unlike visual-first BI tools like Tableau or Power BI, Plotly offers unparalleled control via code. It genuinely feels like a solution built by data scientists for technical teams who require highly customized, interactive analytical applications and not just another static dashboard.
- 🎯 Bonus Resource: Speaking of managing complex data, understanding a database management system is crucial for enterprise needs.
They work with major enterprise players in demanding sectors like finance, energy, and tech, including Fortune 500 firms who must deploy production-grade Python analytics apps at scale.
I’ve found their current strategy really centers on empowering your data science teams. They focus on bridging that critical gap between Python notebooks and secure, shareable business applications, directly solving that common “last-mile” analytics problem.
Now let’s examine their core capabilities.
Plotly Features
Struggling to build interactive data apps without web development skills?
Plotly features empower you to create and deploy powerful analytical web applications entirely in Python. Here are the five main Plotly features that transform your data visualization and app development.
1. Plotly Python, R, and MATLAB Libraries
Are your data visualizations too static to be useful?
Static charts limit deep exploration, making it hard to uncover critical insights. This can lead to missed opportunities in your data analysis.
Plotly’s scientific graphing libraries allow you to generate interactive, high-quality visualizations directly from your preferred coding environments. From my testing, creating dynamic plots like scatter plots and heatmaps is incredibly intuitive, integrating seamlessly with popular data science libraries. This feature provides built-in zooming and panning for enhanced data exploration.
This means you can easily create compelling, interactive visual stories from your data, leading to deeper insights.
2. Dash (Open-Source Python Framework)
Tired of needing front-end developers for data apps?
Building analytical web applications often requires extensive HTML, CSS, and JavaScript knowledge. This slows down your ability to deploy data insights quickly.
Dash, Plotly’s open-source Python framework, lets you build interactive web applications entirely in Python, eliminating the need for complex front-end coding. What I love about this approach is how data scientists can deploy machine learning models into user-friendly web applications with minimal effort.
This helps you bridge the gap between data analysis and application deployment, empowering stakeholders to interact with live data.
- 🎯 Bonus Resource: While we’re discussing application deployment, understanding channel marketing systems is equally important for partner engagement.
3. Dash Enterprise (Production-Grade Data App Platform)
Is scaling your data applications in production a nightmare?
Deploying and securing Python-based data applications for enterprise use can be challenging. This often leads to IT bottlenecks and slow time-to-market.
Dash Enterprise is Plotly’s flagship commercial offering, providing features for building and scaling production-grade data applications. This is where Plotly shines, offering advanced security, one-click deployment, and automated CI/CD. It reduces IT dependence by providing a robust platform for delivering interactive insights and analytics efficiently.
This means you can reliably deliver your data applications to business users, accelerating data-driven decision-making across your organization.
4. Plotly App Studio
Is turning your Jupyter notebooks into shareable apps a hassle?
Operationalizing data science models from notebooks into interactive applications is often a complex, multi-step process. This can delay sharing valuable insights.
Plotly App Studio streamlines the notebook-to-app workflow, making it easier to convert analysis notebooks into interactive web applications. From my testing, this feature provides a more direct path from development to deployment, allowing data scientists to share their work with a broader audience efficiently.
This helps you transform complex analyses into accessible, interactive tools for your team, boosting collaboration and impact.
5. Chart Studio
Do you spend too much time coding basic chart configurations?
Writing repetitive code for standard charts can be tedious and time-consuming. This distracts from higher-value data analysis tasks.
Plotly’s Chart Studio offers a sophisticated web-based editor for creating D3.js and WebGL charts, simplifying the visualization process. This feature reduces the need for repetitive coding, allowing for easy refreshing of visualizations when data changes. It’s particularly useful for generating reports and managing diverse chart types efficiently.
This means you can create high-quality, customizable charts quickly, freeing up your time for deeper analytical work.
Pros & Cons
- ✅ Creates highly interactive and customizable data visualizations for deep exploration.
- ✅ Empowers Python and R users to build full web applications without front-end coding.
- ✅ Dash Enterprise provides robust, scalable platform for production-grade data apps.
- ⚠️ Steeper learning curve for users without prior programming experience.
- ⚠️ Advanced customization can sometimes require more complex technical solutions.
- ⚠️ Open-source deployment and authentication might be more challenging than commercial BI.
These Plotly features work together to create a comprehensive ecosystem for data visualization and application development.
Plotly Pricing
What’s the real cost of data visualization?
Plotly pricing involves a blend of open-source freedom and custom enterprise solutions, meaning you get flexibility but need direct engagement for specific costs.
Cost Breakdown
- Base Platform: Free for open-source (Plotly.js, Dash) / Custom quote for Dash Enterprise
- User Licenses: Not per-user for internal organizational use; unlimited users for visualization service
- Implementation: Varies by complexity (not specified)
- Integrations: Varies by complexity
- Key Factors: Data storage, downloads, specific features, contract duration
1. Pricing Model & Cost Factors
Understanding Plotly’s cost drivers.
Plotly’s pricing for commercial solutions like Dash Enterprise is not publicly listed and operates on a custom quote model. What I found regarding pricing is that costs are influenced by factors like data storage and download volumes rather than a typical per-user model, which can be advantageous for large teams.
From my cost analysis, this means your budget gets a more tailored solution, avoiding generalized pricing that might not fit your specific needs.
- 🎯 Bonus Resource: While we’re discussing data, understanding how to gather market intelligence is crucial. My guide on best web scraping tools offers helpful insights.
2. Value Assessment & ROI
How much value do you get?
Plotly’s open-source offerings provide immense value at no cost, which can significantly reduce your initial investment. For enterprises, Dash Enterprise offers production-grade features that deliver strong ROI by enabling rapid development of data applications and reducing IT dependence for custom dashboards.
This means your organization can scale analytics more efficiently, transforming notebooks into apps without massive upfront development costs.
3. Budget Planning & Implementation
Planning for total cost of ownership.
While open-source components are free, enterprise-level deployment involves custom quotes, so budgeting requires direct engagement. What stands out about their pricing is that it’s designed to scale with your data needs, rather than penalizing you for a growing user base, which can save substantial costs in the long run.
So for your business, expect to discuss specific requirements with sales to ensure the pricing aligns with your project scope and operational scale.
My Take: Plotly’s pricing strategy cleverly combines free, powerful open-source tools with custom-quoted enterprise solutions, making it a flexible choice for both individual developers and Fortune 500 companies.
The overall Plotly pricing reflects scalable value from free tools to enterprise solutions.
Plotly Reviews
What do real Plotly users say?
This customer reviews section dives into real Plotly reviews, analyzing user feedback patterns and experiences to give you an unbiased look at what actual customers think about this software.
1. Overall User Satisfaction
Users praise its powerful visualization capabilities.
From my review analysis, Plotly generally receives positive ratings, especially from users with coding backgrounds who value its interactive visualizations. What I found in user feedback is that users appreciate its sophisticated data exploration features, which significantly enhance their analytical workflows.
This suggests you can expect a high degree of satisfaction if you’re comfortable with programming.
- 🎯 Bonus Resource: While we’re discussing data management and analysis, understanding data loss prevention software is equally important to safeguard your insights.
2. Common Praise Points
Interactive visualizations are a consistent hit.
Users frequently laud Plotly’s interactive plots, including zooming, panning, and tooltips, which truly enhance data exploration. Review-wise, I noticed how often its seamless integration with Python/R is highlighted as a major benefit for data scientists.
This means you can expect powerful, dynamic charts directly from your code, ideal for data presentation.
3. Frequent Complaints
The learning curve can be challenging.
While powerful, Plotly reviews frequently mention a steeper learning curve for those without programming experience, especially when compared to drag-and-drop BI tools. What stood out in customer feedback is how advanced customization can often require complex solutions, which may frustrate some users.
These challenges are typically manageable if you have programming skills or are willing to invest time in learning.
What Customers Say
- Positive: “Plotly is a more sophisticated tool than Matplotlib, and its key advantages are its ability to create interactive plots.” (User Review)
- Constructive: “Deploying and authenticating dashboards with open-source Dash can be more challenging.” (User Review)
- Bottom Line: “Plotly puts the end-to-end data analytics pipeline in your own hands.” (User Review)
The overall Plotly reviews indicate strong approval from technical users, with reservations mainly around its learning curve for non-coders.
Best Plotly Alternatives
Choosing the right data visualization tool?
The best Plotly alternatives include several strong options, each better suited for different business situations, team skill sets, and specific visualization priorities.
- 🎯 Bonus Resource: Before diving deeper, you might find my analysis of best student information systems helpful.
1. Tableau
Need an intuitive, no-code visualization environment?
Tableau excels for business users and analysts who prefer a drag-and-drop interface for quick dashboard creation and self-service data exploration. From my competitive analysis, Tableau simplifies visual data discovery for non-technical users, offering a less code-centric approach than Plotly.
Choose Tableau if your team prioritizes ease of use for quick dashboard creation without writing code.
2. Microsoft Power BI
Already integrated into the Microsoft ecosystem?
Power BI offers a user-friendly experience with seamless integration into Microsoft 365, making it convenient for organizations already using Microsoft products. What I found comparing options is that Power BI simplifies report sharing and authentication within its established environment, often at an affordable initial cost.
Consider this alternative if your organization is heavily invested in Microsoft and needs straightforward report deployment.
3. D3.js
Requiring ultimate customization and bespoke visualizations?
D3.js provides the highest level of control over every pixel and interaction, allowing developers to create highly customized, unique web-based visualizations from scratch. Alternative-wise, D3.js offers unparalleled flexibility for unique designs, ideal for bespoke projects requiring deep JavaScript expertise.
Choose D3.js if you have strong JavaScript skills and need completely custom visualizations with complex interactions.
4. Matplotlib
Preferring static, publication-quality plots in Python?
Matplotlib provides extensive control over every aesthetic element of a plot, making it ideal for creating high-precision, publication-quality static figures. From my analysis, Matplotlib excels at precise static plotting for scientific papers or reports, offering granular control over every visual detail for print.
Consider Matplotlib if your primary need is static, high-quality visualizations for academic or research publications.
Quick Decision Guide
- Choose Plotly: Code-centric interactive visualizations and custom data applications
- Choose Tableau: Intuitive drag-and-drop for business users and self-service BI
- Choose Power BI: Microsoft ecosystem integration and easy report sharing
- Choose D3.js: Unparalleled customization for bespoke web visualizations
- Choose Matplotlib: High-quality static plots for scientific and academic use
The best Plotly alternatives depend on your team’s coding comfort and visualization goals, not just feature lists.
Plotly Setup
What does Plotly implementation actually involve?
This Plotly review section cuts through the marketing to deliver practical insights into its deployment, setup requirements, and user adoption, helping you set realistic expectations.
1. Setup Complexity & Timeline
Not every setup is “one-click easy.”
Plotly implementation varies; open-source libraries are straightforward for developers, but production deployment with authentication requires more effort. For Dash Enterprise, Plotly aims for streamlined, one-click deployments, reducing typical enterprise setup complexities significantly for teams.
You’ll need to assess if your needs align with simpler library installations or more involved enterprise-grade deployments.
2. Technical Requirements & Integration
Prepare for specific coding environment needs.
Plotly’s libraries run on Python, R, or MATLAB, while Dash applications require a Python environment for backend and frontend. What I found about deployment is that your existing tech stack must align with these languages, especially for building Dash apps that leverage Flask and React.js.
Your IT team will need to ensure proper Python environments and cloud deployment readiness for enterprise solutions like Dash Enterprise.
- 🎯 Bonus Resource: Speaking of managing complex data, you might find my guide on best PIM software helpful for streamlining product rollouts.
3. Training & Change Management
Coding experience impacts your learning curve.
The learning curve for Plotly’s graphing libraries is manageable for coders, but less so for those without programming experience compared to drag-and-drop tools. From my analysis, successful adoption requires investing in programming training for your team, particularly in Python and the Dash framework.
You should plan for dedicated training to empower users to leverage Plotly’s full capabilities and overcome initial coding hurdles.
4. Support & Success Factors
Vendor and community support are key.
Plotly provides extensive documentation and an active community forum for its open-source offerings, while Dash Enterprise includes dedicated commercial support. From my implementation analysis, leveraging these support channels is crucial for troubleshooting and maximizing your investment.
Your team should actively use the documentation and community resources, and factor in vendor support for complex enterprise deployments.
Implementation Checklist
- Timeline: Weeks to months depending on solution and complexity
- Team Size: Developers for open-source; IT/data engineers for enterprise
- Budget: Software cost plus training and potential professional services
- Technical: Python environment, cloud platform, and existing data sources
- Success Factor: Team’s coding proficiency and dedicated training efforts
Plotly setup success hinges on aligning your team’s technical skills with the solution’s requirements, especially for enterprise-level deployments.
Bottom Line
Is Plotly the right visualization tool for you?
This Plotly review delivers a comprehensive final assessment, guiding you on who benefits most from its powerful, code-driven data visualization and application development capabilities.
1. Who This Works Best For
Teams prioritizing custom, code-driven data visualization.
Plotly is ideal for data scientists, data analysts, and developers with programming skills (Python, R, JavaScript) needing granular control over visualizations and interactive web applications. What I found about target users is that teams building production-grade data applications for real-time insights find immense value in its capabilities.
You’ll succeed if your current BI tools lack the flexibility to operationalize complex analytics and machine learning models effectively.
2. Overall Strengths
Unparalleled customization for interactive data applications.
Plotly excels in creating highly interactive and customizable charts, especially when paired with Dash for building full-fledged web applications directly from Python code. From my comprehensive analysis, seamless integration with Python and R workflows empowers data professionals to build sophisticated tools.
These strengths translate into dynamic data exploration, enhanced analytical operationalization, and a significant competitive edge for your business.
- 🎯 Bonus Resource: Before diving deeper into data, my guide on best test maker software can help with robust assessments.
3. Key Limitations
A steeper learning curve for non-technical users.
While powerful, Plotly presents a notable learning curve for individuals without programming experience compared to drag-and-drop BI tools. Based on this review, advanced customization and open-source Dash deployment can demand significant technical effort and specialized knowledge.
These limitations are important considerations, but manageable trade-offs if your team has the necessary technical proficiency and a clear need for custom development.
4. Final Recommendation
Plotly is strongly recommended for technical teams.
You should choose Plotly if your organization has programming expertise and seeks to build highly interactive, custom data applications that go beyond standard BI tool capabilities. From my analysis, this solution thrives in a code-centric environment where deep integration with data science workflows is a priority.
My confidence level is high for data-driven enterprises and tech-savvy teams aiming for bespoke visualization solutions.
Bottom Line
- Verdict: Recommended for technical teams and data-driven enterprises
- Best For: Data scientists, analysts, and developers with programming skills
- Business Size: Small teams to Fortune 500 enterprises needing custom data apps
- Biggest Strength: Highly interactive, customizable, and code-driven visualizations
- Main Concern: Steeper learning curve for users without programming experience
- Next Step: Explore open-source libraries or request Dash Enterprise demo
This Plotly review confirms its significant value for code-proficient teams, emphasizing its strengths while also preparing you for its technical demands.


