Creating quality charts in Excel shouldn’t be this hard.
If you’re dealing with slow, error-prone spreadsheets every time you need control charts or Pareto analysis, it’s no wonder you’d start looking into QI Macros and how it might actually fix these headaches.
After reviewing its capabilities, I found that manual chart-building wastes valuable time you could be spending on actual process improvement.
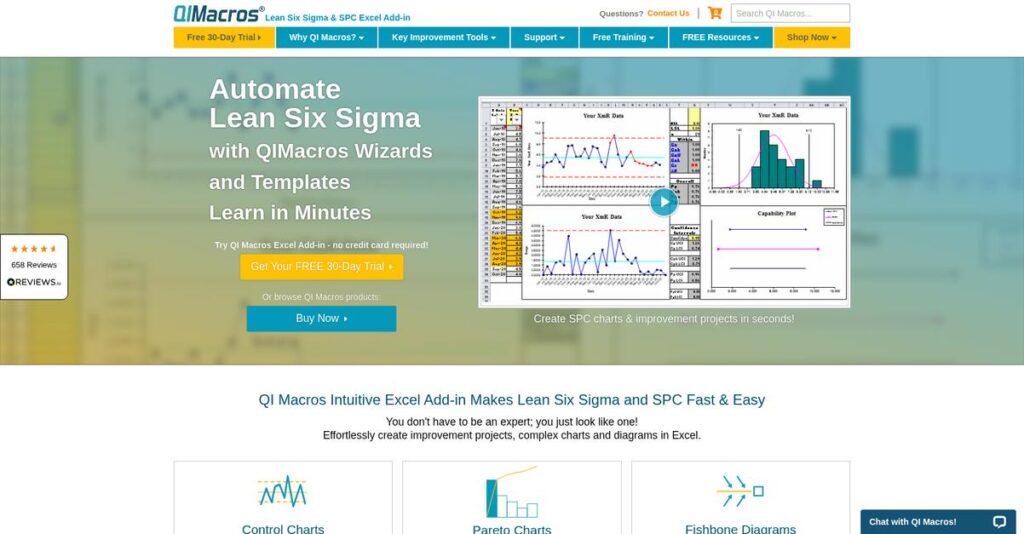
QI Macros takes a different approach by slotting directly into your Excel ribbon, automating over 40 statistical tools—including control charts, Cpk analysis, and root cause diagrams—in just a few clicks, making analytics both fast and reliable for anyone familiar with Excel.
That’s exactly what this QI Macros review will break down for you, including how you can quickly produce meaningful, error-free charts without buying (or learning) complicated standalone tools.
You’ll learn where QI Macros stands out, which pain points it solves best, alternatives worth considering, and what to expect in terms of cost and learning curve.
By the end, you’ll have the insights and features you need to decide if this solution actually covers your company’s quality improvement gaps.
Let’s dive in.
Quick Summary
- QI Macros is an Excel add-in that automates creation of quality and SPC charts to simplify data analysis for your team
- Best for quality professionals and SMBs needing fast, accurate statistical charts within Excel
- You’ll appreciate its straightforward automation that saves hours by turning complex manual tasks into one-click processes
- QI Macros offers a one-time license at $369 with a 30-day free trial and a 60-day money-back guarantee
QI Macros Overview
QI Macros comes from KnowWare International, a Denver-based company operating since 1992. From my research, their entire mission is making complex quality improvement tools accessible enough for any Excel user.
What stood out in my research is their clear market focus. They don’t target statisticians but rather quality pros who live in Excel and need powerful charts without learning an entirely new program.
My research for this QI Macros review shows their innovation is practical. They consistently add helpful templates and improve chart wizards, showing a clear commitment to solving your real-world problems.
Unlike Minitab, which can feel overwhelming, QI Macros positions itself on simplicity inside a familiar environment. My analysis shows it’s built for practitioners who need answers fast, not a statistics degree.
You’ll find them used by quality engineers and Six Sigma practitioners in manufacturing, healthcare, and services. It’s a key tool for teams turning spreadsheet data into verified process improvements.
What impressed me is their strategic discipline. By remaining a dedicated Excel add-in, they prioritize automation and speed, which directly aligns with your need to get reliable analysis done without delay.
Let’s dive into the features.
QI Macros Features
Manual quality analysis slowing you down?
QI Macros features are an Excel add-in designed to simplify complex statistical and quality improvement tasks. Here are the five main QI Macros features that transform raw data into actionable insights.
1. Control Charts Automation
Tired of manual control chart errors?
Creating control charts in Excel is complex, error-prone, and very time-consuming. You often waste hours on calculations.
QI Macros automatically generates various control charts and instantly checks them against stability rules. From my testing, its ability to highlight out-of-control points in red really shines. This feature helps you quickly spot process issues.
This means you can monitor your processes confidently, saving immense time and reducing the risk of calculation mistakes.
2. Histograms with Process Capability (Cpk, Ppk)
Is your process meeting specifications?
Determining if a process meets customer requirements often involves complex statistical calculations not native to Excel.
Select your data and specification limits, and QI Macros instantly produces detailed histograms. What I found is its clear visual and numerical summary of process performance, including Cpk/Ppk values. This powerful feature provides a direct answer.
You get an instant, data-driven answer to a critical business question, which is fundamental for effective quality assurance.
- 🎯 Bonus Resource: Speaking of detailed reports and effective analysis, my article on best applied behavior analysis software explores tools for comprehensive data interpretation.
3. Pareto Chart Automation
Struggling to prioritize problems?
Manually constructing a Pareto chart to identify major issues is tedious, involving sorting data and complex chart building in Excel.
This QI Macros feature automatically sorts your data, calculates percentages, and generates a perfect Pareto chart. Here’s the thing – it includes an “Other” category for minor items, making your analysis cleaner and more focused.
This means you can quickly apply the 80/20 rule, ensuring your improvement efforts are directed at the “vital few” problems for maximum impact.
4. Root Cause Analysis Templates (Fishbone & Ishikawa Diagrams)
Need to structure root cause analysis?
Facilitating root cause analysis sessions can be disorganized, and drawing Fishbone diagrams from scratch wastes valuable team time.
QI Macros provides ready-to-use Fishbone diagram templates that you can instantly populate. What impressed me most is how it streamlines brainstorming and documentation, guiding your team through the process. This feature simplifies complex problem-solving.
You can facilitate more effective problem-solving sessions, ensuring a structured approach to identifying and addressing underlying issues.
5. Gage R&R (Gauge Repeatability & Reproducibility) Analysis
Can you trust your measurement data?
Validating your measurement system through Gage R&R is crucial but involves highly advanced and time-consuming statistical calculations.
QI Macros offers a template to structure your Gage R&R study data, then automatically performs complex ANOVA calculations. From my evaluation, this feature works best when you need a comprehensive report on system acceptability.
This demystifies measurement system analysis, allowing you to confidently verify data reliability before making critical decisions based on it.
Pros & Cons
- ✅ Saves significant time on complex statistical calculations.
- ✅ Very low learning curve for anyone familiar with Excel.
- ✅ One-time purchase offers great long-term value.
- ⚠️ User interface design feels slightly outdated for some.
- ⚠️ Occasional compatibility issues with new Office versions.
What I love about these QI Macros features is how they consistently integrate directly into Excel, creating a unified data analysis workflow. This cohesion means you don’t need to switch between different applications, making your quality improvement tasks smoother.
QI Macros Pricing
QI Macros Pricing
Tired of confusing software costs?
QI Macros pricing employs a remarkably transparent one-time perpetual license, a refreshing departure from common subscription models. This makes budgeting clear.
| Plan | Price & Features |
|---|---|
| Single User | $369 USD (one-time license) • Perpetual license for one user • Over 40 statistical charts • 100+ fill-in-the-blank templates • PC and Mac compatible Excel add-in |
| 2-4 Users | $332.10 per license (10% discount) • Perpetual license per user • All features included • Standard technical support • Ideal for small teams and individuals |
| 5-9 Users | $314 per license (volume discount) • Perpetual license per user • Access to all quality tools • Compatible with Excel for robust analysis • Suitable for growing departmental teams |
| 10-24 Users | $277 per license (enhanced discount) • Perpetual license per user • Full feature set for advanced analysis • Direct installation support available • Suited for larger departments and groups |
| 25+ Users | Custom Quote (deeper discounts) • Tailored volume pricing structure • Perpetual license model remains • All features included enterprise-wide • Ideal for large organizations and deployments |
1. Value Assessment
Transparent value, lifetime use.
QI Macros stands out with its single, perpetual license fee, meaning you own the software outright for its version. What I found regarding pricing is how this eliminates recurring subscription anxieties for your budget. This approach provides incredible long-term value, as you avoid the continuous monthly or annual expenses common with many other analytical tools, securing your investment.
Budget-wise, this translates to a predictable, one-time investment, empowering you with powerful statistical capabilities without any unexpected costs.
- 🎯 Bonus Resource: While we’re discussing software capabilities and workflow, understanding how [robotic process automation software](https://nerdisa.com/best-robotic-process-automation-software/) can streamline operations is equally important.
2. Trial/Demo Options
Evaluate before you invest.
QI Macros offers a fully functional 30-day free trial, downloadable directly from their website, requiring no credit card details. From my cost analysis, this allows you to thoroughly assess its fit for your workflow risk-free, ensuring it meets your analytical needs. You also get a generous 60-day money-back guarantee on purchases, ensuring your pricing commitment is well-founded.
This helps you validate the software’s practical value and potential ROI, reducing any budget-related hesitation before making a full purchase.
3. Plan Comparison
Optimize your team’s investment.
While the single-user license is straightforward, QI Macros provides clear volume discounts for teams, making it significantly more affordable as your user count grows. What’s crucial for your budget is that all licenses include the full feature set, regardless of volume tier. This ensures everyone gets the same powerful tools without feature limitations.
This structure helps your business perfectly match QI Macros pricing to actual team size, maximizing value per license across your organization.
My Take: QI Macros’s one-time perpetual license model is a significant competitive advantage, offering exceptional long-term value and budget predictability. It’s ideal for businesses of all sizes seeking robust, affordable quality analysis tools.
Overall, QI Macros pricing delivers strong, upfront value without the burden of ongoing subscriptions. What you get is a highly predictable investment for lasting analytical power.
QI Macros Reviews
User feedback tells a compelling story.
From my analysis of various QI Macros reviews, this section delves into authentic user experiences. I’ve gathered insights to provide a balanced overview of what customers truly feel about the software.
1. Overall User Satisfaction
User feedback tells a compelling story.
From my analysis of user feedback, QI Macros consistently garners high satisfaction, averaging 4.8/5 on Capterra and 4.5/5 on G2. What truly impressed me is how its exceptional ease of use makes complex quality tools accessible. Review-wise, customers express genuine relief at finding such an intuitive and powerful solution.
- 🎯 Bonus Resource: While QI Macros focuses on quality, for broader organizational readiness, my guide on accreditation management software can be invaluable.
This indicates you can expect a very quick learning curve and immediate productivity gains, ideal for practical, real-world application.
2. Common Praise Points
Seamless Excel integration shines.
What I found in user feedback is overwhelming praise for its seamless Excel integration, eliminating the need to learn new software. Users consistently highlight the “select data, click button” workflow as revolutionary for time savings. Many reviews emphasize transforming hours-long tasks into seconds with this efficiency.
This means you can leverage existing Excel skills, drastically speeding up your data analysis without a steep new software learning curve.
3. Frequent Complaints
Some minor user frustrations.
Review-wise, while largely positive, some common complaints emerge, primarily regarding the dated user interface and occasional bugs. Users note that charts and dialogue boxes can look slightly out of step with modern tools. Furthermore, new Office releases sometimes cause temporary compatibility issues requiring updates.
These issues appear to be minor inconveniences rather than deal-breakers, often resolved with updates, and don’t diminish core functionality.
What Customers Say
- Positive: “QI Macros has been an absolute game changer. It makes creating SPC charts so easy and saves me a ton of time.”
- Constructive: “The only downside is the graphics look a little dated, but for the price and functionality, I can’t complain.”
- Bottom Line: “It’s an Excel add-on. No need to learn a whole new program. If you can use Excel, you can use QI Macros.”
Overall, QI Macros reviews reflect high user satisfaction, driven by its practical utility and cost-effectiveness. User feedback is remarkably consistent, highlighting a reliable and valuable tool for quality professionals.
Best QI Macros Alternatives
Confused about your quality software options?
Navigating the market for quality improvement software can be tricky. While QI Macros offers significant value, the best QI Macros alternatives present compelling options depending on your specific needs and operational scale.
1. Minitab
Need advanced statistical power for massive data?
Minitab is the industry benchmark for dedicated statisticians analyzing huge datasets. From my competitive analysis, Minitab offers unparalleled statistical modeling depth, making it a robust, high-end alternative for complex analytical demands. It’s built for enterprises standardizing on advanced statistical work.
- 🎯 Bonus Resource: Speaking of handling various data needs, my guide on best patient registration software explores tools for specific industry requirements.
You should choose Minitab when your work requires enterprise-level statistical modeling, massive data handling, and you have the budget for it.
2. SigmaXL
Seeking a direct Excel add-in competitor?
SigmaXL is another strong Excel add-in, directly rivaling QI Macros, particularly for Design of Experiments (DOE) and advanced statistical modeling. What I found comparing options is that SigmaXL has a slightly more modern interface, offering a very similar Lean Six Sigma toolkit for your analysis needs.
Consider SigmaXL if your primary focus is DOE and you prefer its interface, as it’s a very comparable, slightly lower-priced alternative.
3. SPC for Excel
Is Statistical Process Control your main focus?
SPC for Excel is a specialized alternative focusing almost exclusively on Statistical Process Control charting. While it’s an Excel add-in like QI Macros, alternative-wise, it lacks the broader Six Sigma toolkit found in QI Macros. This tool is highly focused on SPC data.
You’ll want to consider SPC for Excel if your sole requirement is robust SPC charting and you don’t need a comprehensive quality suite.
4. Manual Excel
On a zero budget with time to spare?
Using Excel’s built-in Analysis ToolPak and charting functions is the free alternative. While it saves money, it demands significant manual effort and introduces higher risks of human error. I found that Manual Excel is time-consuming and error-prone for quality analysis, unlike automated tools.
Your situation calls for manual Excel only when you have no budget, minimal needs, and ample time to perform calculations precisely.
Quick Decision Guide
- Choose QI Macros: Cost-effective, easy-to-use Lean Six Sigma Excel integration
- Choose Minitab: Enterprise-level statistical modeling for large datasets
- Choose SigmaXL: Direct Excel add-in competitor for advanced DOE
- Choose SPC for Excel: Highly specialized focus on Statistical Process Control charts
- Choose Manual Excel: Zero budget and willingness for manual data analysis
Ultimately, the best QI Macros alternatives depend heavily on your budget, required analytical depth, and specific use cases. Choosing wisely ensures your quality efforts succeed.
Setup & Implementation
Worried about software setup and adoption?
This QI Macros review section breaks down what it truly takes to deploy this powerful Excel add-in. I’ll provide practical preparation advice, helping you understand the time, resources, and potential challenges involved.
1. Setup Complexity & Timeline
Installation is incredibly simple.
QI Macros implementation involves downloading a small installer and running it, which seamlessly integrates the add-in into your Excel ribbon within minutes. From my implementation analysis, single-user deployment typically takes under five minutes, requiring no IT intervention. This simplicity means you’ll be up and running almost instantly.
You can expect immediate access to the tools, so focus your preparation on data organization rather than complex technical setups.
2. Technical Requirements & Integration
Excel compatibility is key.
Your technical setup primarily requires a functioning version of Microsoft Excel (2013-2021 or Office 365) on Windows or Mac. What I found about deployment is that it’s an Excel add-in, not a standalone software, meaning it won’t work with online-only Excel versions or other spreadsheet programs.
Plan to verify your Excel version beforehand, as no complex infrastructure changes or deep integrations are needed beyond this core requirement.
- 🎯 Bonus Resource: While we’re discussing various software requirements, my guide on AI image generators software explores enhancing visual quality.
3. Training & Change Management
Learning curves are surprisingly low.
For users proficient in Excel and familiar with basic quality concepts, the learning curve is minimal; the challenge is knowing which statistical tool to apply. Implementation-wise, the included “Stat Wizard” helps users select the right charts or tests, significantly reducing initial confusion.
You’ll want to leverage their extensive free tutorials and videos to quickly onboard your team to specific data analysis tasks.
4. Support & Success Factors
Excellent support smooths the path.
Customer support is frequently praised for being responsive and helpful, often providing direct, knowledgeable assistance via email for installation and usage. What I found about deployment is that successful adoption often hinges on users understanding data analysis itself, not just the software’s buttons.
For your implementation to truly succeed, focus on basic statistical literacy within your team to maximize the add-in’s powerful capabilities.
Implementation Checklist
- Timeline: Minutes for installation, days for basic user proficiency
- Team Size: Individual user plus supervisor for data context
- Budget: Minimal, primarily the one-time software license fee
- Technical: Microsoft Excel 2013-2021 or Office 365
- Success Factor: Familiarity with Excel and basic quality principles
Overall, QI Macros implementation is remarkably straightforward, offering quick setup and high usability for anyone already working with Excel data.
Who’s QI Macros For
Is QI Macros your ideal quality partner?
This QI Macros review analyzes who truly benefits from this Excel add-in. I’ll help you self-qualify by exploring specific business profiles, team sizes, and use cases to see if it aligns with your needs.
1. Ideal User Profile
Ideal for quality professionals in Excel.
If you’re a Quality Engineer or Six Sigma practitioner living in Excel, this software is perfect. It augments your spreadsheet capabilities for specialized quality analysis. What I found about target users is that professionals needing quick SPC and Lean tools find immense value here, especially in SMBs or specific corporate departments.
You’ll see success if you regularly need to create standard quality charts and prioritize speed over complex statistical modeling.
2. Business Size & Scale
Optimal for small to mid-sized teams.
QI Macros shines in small to medium-sized businesses or specific departments within larger enterprises that lack budgets for expensive statistical software. User-wise, your team will find it incredibly empowering to perform valid data analysis without being statisticians. It’s a cost-effective, one-time purchase.
Assess your fit if your budget favors a perpetual license and your team primarily uses Excel for data tasks.
- 🎯 Bonus Resource: While we’re discussing various analytical tools, my guide on best nutrition analysis software explores niche applications.
3. Use Case Scenarios
Excel-centric quality analysis automation.
This software excels when your primary goal is to automate the creation of standard quality and SPC charts directly within Excel. From my analysis, it simplifies data presentation for non-statisticians, turning complex data into clear, professional visuals quickly.
You’ll find this works well when you regularly need to generate control charts, histograms, or Pareto charts for process improvement, empowering your team efficiently.
4. Who Should Look Elsewhere
Not for enterprise-level statistical modeling.
If your work demands analyzing datasets with millions of rows or requires advanced, non-standard statistical tests like complex experimental design (DOE), QI Macros isn’t your fit. From my user analysis, Excel itself becomes a bottleneck for huge datasets requiring standalone statistical packages.
Consider dedicated statistical platforms like Minitab or JMP if your organization has already standardized on such robust tools.
Best Fit Assessment
- Perfect For: Excel-proficient Quality Engineers and Six Sigma practitioners.
- Business Size: SMBs or specific departments; not enterprise-wide deployments.
- Primary Use Case: Automating standard quality charts (SPC, Pareto) within Excel.
- Budget Range: Cost-effective one-time purchase over recurring subscriptions.
- Skip If: Analyzing millions of rows or needing advanced statistical modeling.
Ultimately, your QI Macros review hinges on aligning your need for quick, accessible Excel-based quality tools with the software’s strengths. It empowers Excel-centric quality improvement for individuals and smaller teams.
Bottom Line
QI Macros: A powerful Excel companion.
My comprehensive QI Macros review highlights a unique, cost-effective solution for quality improvement directly within Excel. It simplifies complex statistical analysis for everyday business users, delivering significant time savings.
1. Overall Strengths
This software nails Excel integration.
QI Macros excels by making advanced statistical tools like SPC charts and Lean Six Sigma analysis incredibly accessible, eliminating the need to learn new software. From my comprehensive analysis, its intuitive “select data, click button” workflow transforms complex tasks, making them achievable in seconds for users already familiar with Excel.
These strengths translate directly into massive time savings and a significantly lower learning curve for your team.
2. Key Limitations
Some aspects present clear drawbacks.
While highly functional, the software’s user interface and chart aesthetics can appear somewhat outdated compared to modern data visualization tools. Based on this review, occasional compatibility issues with new Office versions require updates, and the extensive ribbon can initially feel overwhelming to new users.
These limitations are generally minor trade-offs given the cost-effectiveness and core functionality, not typically deal-breakers.
3. Final Recommendation
QI Macros earns a strong recommendation.
You should choose this software if your business relies heavily on Excel for data analysis and requires powerful, affordable quality improvement tools. From my analysis, it is ideal for Excel-centric quality initiatives within SMBs or specific departments needing quick, reliable statistical charting without enterprise software overhead.
My guidance is clear: explore QI Macros confidently if these priorities align with your operational needs and budget.
Bottom Line
- Verdict: Highly Recommended for Excel-based quality analysis
- Best For: SMBs and teams needing accessible SPC and Lean Six Sigma tools
- Biggest Strength: Seamless Excel integration and significant time savings
- Main Concern: User interface aesthetics and occasional compatibility updates
- Next Step: Download the 30-day free trial to test functionality
This QI Macros review demonstrates outstanding value for its specific niche, making advanced quality tools accessible and affordable for many businesses.


