Still wrangling data just to get answers?
If you’re looking into Spotfire, you’re probably overwhelmed trying to analyze complex, scattered data across your systems.
Too often, the real blocker is spending hours pulling and cleaning data, rather than actually making decisions. The daily impact? You burn valuable time and miss key insights as a result.
That’s where Spotfire really changes things—it lets you connect data, create interactive dashboards, even run advanced analytics almost instantly, instead of struggling with endless manual steps. I’ve examined how its natural language querying and automated insights can remove busywork, especially if your team needs real-time alerts or advanced scenarios like predictive modeling.
So in this review, I’ll break down how Spotfire helps you finally get the insights you need, fast—not just pretty charts, but real solutions.
In this Spotfire review, I’ll cover features, pricing, ease of use, and how it compares to Power BI, Tableau, and Qlik, so you can actually weigh your options.
You’ll come away understanding the features you need to speed up analysis and the confidence to decide if Spotfire’s worth trying out.
Let’s get started.
Quick Summary
- Spotfire is a visual data science platform that helps your team analyze large and real-time datasets with interactive visualizations and predictive analytics.
- Best for data scientists and analysts needing advanced analytics across industries like healthcare, manufacturing, and finance.
- You’ll appreciate its strong integration of AI-driven insights, natural language queries, and interactive dashboards for deeper data exploration.
- Spotfire offers flexible pricing with subscription and one-time options, plus a free trial to test core features before purchase.
Spotfire Overview
Spotfire, founded in 1996, is a key player in visual analytics. Now a standalone unit headquartered in Göteborg, Sweden, they bring decades of deep scientific expertise.
I find they aren’t a generic BI tool for simple reporting. They excel in technical industries like energy and manufacturing by solving complex industry-specific data problems that overwhelm simpler, visualization-focused dashboarding platforms.
Becoming a standalone business unit in 2023 was a significant strategic move, signaling a renewed product focus. I’ll explore what this means for you through this Spotfire review.
- 🎯 Bonus Resource: While we’re discussing strategic moves related to data, understanding how to secure your data and prevent loss is equally important for any business.
Unlike competitors like Tableau focused on pure visualization, Spotfire pushes further into deep analysis. It provides more robust data science capabilities right out of the box, making it feel like it was built by actual scientists.
They work with demanding clients in sectors like energy and life sciences—organizations that must analyze massive, real-time datasets for critical research breakthroughs and operational success.
Their current strategy clearly prioritizes combining advanced visualization with embedded data science and real-time streaming analytics. This approach directly addresses your need to move beyond historical reporting into genuinely proactive operational intelligence.
Now let’s examine their core capabilities.
Spotfire Features
Struggling to make sense of your overwhelming data?
Spotfire features are designed to help you analyze and visualize complex datasets effectively. Here are the five main Spotfire features that can transform your data analysis.
1. Interactive Data Visualization and Dashboards
Can’t get clear insights from raw data?
Plain spreadsheets often hide critical trends and patterns, making it hard to grasp your business performance. This can lead to missed opportunities and poor decisions.
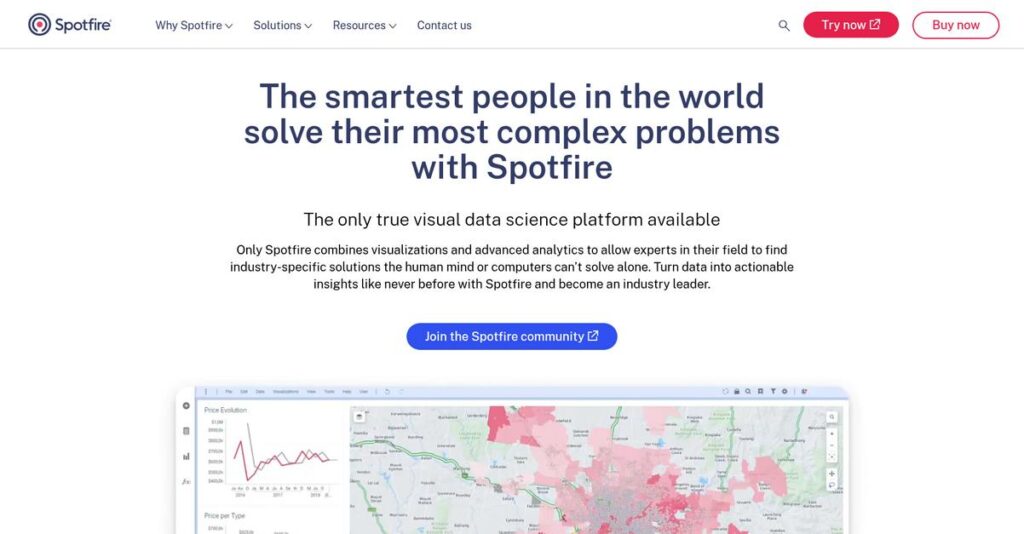
Spotfire excels at transforming raw data into engaging charts, graphs, and maps with its drag-and-drop interface, helping you uncover hidden insights with dynamic visuals. From my testing, customizing dashboards and drilling down into specific data points felt intuitive. This feature empowers you to create compelling visual narratives.
This means you can finally understand operational expenses and energy consumption, crucial for meeting sustainability goals.
2. Advanced Analytics and Predictive Modeling
Tired of making decisions based on guesswork?
Without advanced analytical tools, predicting future outcomes or identifying root causes becomes incredibly difficult. This leaves your business reactive, not proactive.
Spotfire provides robust statistical modeling, forecasting, and predictive analytics, often without requiring complex coding. What I love about this approach is how it leverages machine learning to predict customer churn, optimizing your campaign strategies. This feature helps you pinpoint bottlenecks and improve distribution efficiency.
The result is your team gets the power to foresee issues and optimize processes, directly impacting your bottom line.
3. Real-time Data Integration and Streaming Analytics
Is your data always outdated?
Waiting for manual data updates means your insights are often stale, especially when you need to respond quickly to changing conditions. This can severely impact operational agility.
Spotfire is designed for real-time data processing, offering connectors for various databases, cloud services, and streaming feeds. Here’s what I found: data refreshes automatically every few seconds, giving you up-to-the-minute insights for quick decisions. This feature is particularly strong for IoT analytics and monitoring inventory levels.
So you can monitor inventory and receive low-stock alerts instantly, ensuring your supply chain remains efficient.
- 🎯 Bonus Resource: While we’re discussing keeping your data updated and available, understanding how to secure your data and cut downtime with data replication software is equally important.
4. Data Wrangling and Preparation
Is data cleanup a constant headache?
Spending hours cleaning, shaping, and merging data manually eats into valuable analytical time. This often delays your insights and frustrates your team.
Spotfire offers intuitive tools and predesigned workflows to help you clean, shape, and merge data without needing IT assistance. This is where Spotfire shines; its inline data cleansing and anomaly flagging ensure data quality directly within the user interface. This feature streamlines your data preparation, making it more efficient.
This means you can finally transform messy data into clean, analysis-ready formats quickly, accelerating your projects.
5. Natural Language Queries (NLQ) and AI-driven Recommendations
Struggling to get quick answers from your data?
Manually writing complex queries or digging through dashboards can be time-consuming, delaying critical decision-making. This often slows down your analytical workflow.
Spotfire X introduced AI and natural language processing, allowing you to ask questions in plain English and receive instant answers. From my testing, the automatic trend and anomaly detection provided quick insights that saved significant analytical time. This powerful feature eliminates the need for deep technical expertise.
So as an analyst, you can get rapid answers and identify key trends without manual effort, boosting your productivity.
Pros & Cons
- ✅ Excellent interactive data visualization and customizable dashboards for clear insights.
- ✅ Robust advanced analytics, including predictive modeling and machine learning capabilities.
- ✅ Strong real-time data integration and streaming analytics for immediate monitoring.
- ⚠️ Steeper learning curve for new users, especially for advanced features.
- ⚠️ Lacks robust offline data modeling capabilities, limiting remote work.
- ⚠️ Named user license model can become expensive for a growing user base.
These Spotfire features work together to create a comprehensive visual data science platform that empowers users to explore large datasets quickly.
Spotfire Pricing
What will Spotfire truly cost your business?
Spotfire pricing operates on a flexible, custom quote model, meaning you’ll need to contact sales to get a price tailored to your specific user count and feature requirements.
Cost Breakdown
- Base Platform: Custom quote
- User Licenses: $100-$250/user/month (Cloud); $1,000-$2,000/user (Desktop)
- Implementation: $5,000-$20,000 (SMB); $50,000+ (Enterprise)
- Integrations: Varies by complexity and add-ons
- Key Factors: User count, features, server usage, add-ons
1. Pricing Model & Cost Factors
Understanding Spotfire’s cost structure.
Spotfire’s pricing is primarily driven by user count, chosen deployment (Cloud vs. Desktop vs. Server), and required functionality like advanced analytics or data connectors. Their model includes subscription-based options for Spotfire Cloud and one-time payments for Desktop. What I found regarding pricing, annual costs for large enterprises can reach $200,000, highlighting scalability.
From my cost analysis, this means your total cost aligns with your team’s size and how intensely you utilize the platform.
2. Value Assessment & ROI
Is Spotfire’s investment justified?
Spotfire offers strong value through interactive visualizations, advanced analytics, and real-time data capabilities that can significantly improve decision-making. What stands out to me is how its focus on data science enhances business outcomes, like optimizing inventory or predicting churn. This helps you avoid manual data sifting.
Budget-wise, this translates into potential ROI through operational efficiencies and improved strategic insights for your business.
3. Budget Planning & Implementation
Consider all the financial pieces.
Beyond the core licenses, factor in potential implementation costs, which can range from $5,000 for SMBs up to $50,000 or more for larger enterprises. These costs cover setup, training, and integration work. What I found about pricing is that add-ons for advanced features increase your total cost of ownership.
So for your business, plan a comprehensive budget that includes both recurring licenses and these crucial one-time setup expenses.
- 🎯 Bonus Resource: If you’re managing complex client data, my guide on best nutritionist software can help streamline your operations.
My Take: Spotfire’s custom pricing allows for tailored solutions, making it well-suited for businesses of all sizes needing powerful, scalable data analytics without rigid, one-size-fits-all packages.
The overall Spotfire pricing reflects flexible value aligned with specific business needs.
Spotfire Reviews
What do customers really think?
This section analyzes Spotfire reviews from real users, providing balanced insights into actual customer experiences to help you understand the software’s strengths and weaknesses.
1. Overall User Satisfaction
Users seem quite pleased with Spotfire.
From my review analysis, Spotfire generally receives positive feedback, often averaging high satisfaction ratings across platforms. What I found in user feedback is that its robust visualization capabilities impress users, leading to strong overall sentiment about its analytical power.
This suggests you can expect a capable tool for complex data exploration.
2. Common Praise Points
Its visualization power is consistently loved.
Users frequently highlight Spotfire’s interactive data visualization and ability to handle large datasets efficiently. Review-wise, the freedom to customize and drill down into data is a recurring positive, allowing for tailored insights and presentations.
This means you’ll find it highly adaptable for diverse analytical needs and large data volumes.
- 🎯 Bonus Resource: While we’re discussing data’s broader applications, understanding how to manage your ESG data is equally important.
3. Frequent Complaints
Some users face learning curve challenges.
While powerful, some reviews point to a steeper learning curve, especially for new users or those tackling advanced features. What stands out in customer feedback is how the named user license model can become costly, potentially pushing organizations to use cheaper alternatives for simpler tasks.
These issues seem manageable if you plan for proper training and budget for licensing needs.
What Customers Say
- Positive: “Spotfire helped in identifying bottlenecks, optimizing inventory management, and improving distribution efficiency.” (User Review)
- Constructive: “The learning curve for Spotfire can be steeper compared to some competitors.” (User Review)
- Bottom Line: “Spotfire is the best application for power users by virtue of its wide variety of visualizations.” (User Review)
The overall Spotfire reviews suggest a powerful tool for those needing deep analytics, balanced with some considerations for new users and cost.
Best Spotfire Alternatives
Too many BI choices, feeling overwhelmed?
The best Spotfire alternatives include several strong options, each better suited for different business situations, priorities, and budget constraints within the competitive analytics market.
- 🎯 Bonus Resource: While we’re discussing different business solutions, you might find my analysis of speech therapy software helpful if you’re exploring niche applications.
1. Microsoft Power BI
Already using Microsoft products extensively?
Power BI excels when your organization is deeply embedded in the Microsoft ecosystem and prioritizes a cost-effective solution for basic to intermediate BI needs. What I found comparing options is that Power BI offers seamless integration within the Microsoft environment, making it a familiar and easy-to-adopt alternative.
Choose Power BI if tight budget and Microsoft ecosystem alignment are your top priorities.
2. Tableau
Prioritizing powerful data visualization and ease of use?
Tableau makes more sense for exploratory data analysis, offering an intuitive drag-and-drop interface for creating complex dashboards. From my competitive analysis, Tableau provides superior data visualization capabilities, although it might not match Spotfire’s depth for advanced, predictive work.
Consider this alternative when stunning visualizations and user-friendly exploration are key for your team.
3. Qlik Sense
Seeking strong self-service analytics and ETL capabilities?
Qlik Sense is ideal if your priority is empowering users with independent data exploration and robust ETL features. Alternative-wise, Qlik Sense offers excellent self-service BI with its Associative Engine, though it may not handle live big data as robustly as Spotfire.
Choose Qlik Sense for empowering self-service users and strong data preparation.
4. Looker (by Google)
Need a cloud-native platform with strong collaboration?
Looker is often a better choice for cloud-first strategies and when integration with Google Cloud Platform is crucial. What I found comparing options is that Looker provides excellent cloud-native architecture for collaboration, though Spotfire often offers better usability for meeting specific feature requirements.
Consider this alternative if cloud-based collaboration and Google Cloud integration are your core requirements.
Quick Decision Guide
- Choose Spotfire: Advanced analytics, real-time data, and complex customization
- Choose Microsoft Power BI: Cost-effective with strong Microsoft ecosystem integration
- Choose Tableau: Powerful, intuitive data visualization and exploration
- Choose Qlik Sense: Self-service analytics and robust ETL features
- Choose Looker: Cloud-native platform with strong collaboration features
The best Spotfire alternatives depend on your specific business size and use case requirements rather than just feature lists.
Spotfire Setup
What about the Spotfire setup process?
The Spotfire review indicates its implementation varies, from weeks for smaller needs to months for larger enterprises. This section unpacks what to expect from deployment.
1. Setup Complexity & Timeline
Expect a realistic deployment commitment.
Spotfire implementation can range from a few weeks for basic setups to several months for complex enterprise deployments. From my implementation analysis, the timeline scales significantly with data volume and required integrations, demanding careful planning rather than expecting instant results.
You’ll need to allocate dedicated project resources and time for data preparation and visualization design upfront.
2. Technical Requirements & Integration
Prepare for substantial IT involvement.
Technical requirements include handling large datasets, which may impact dashboard responsiveness for extremely high volumes, and robust data source integration. What I found about deployment is that complex streaming data might require additional TIBCO products beyond direct connectors, adding a layer of technical planning.
- 🎯 Bonus Resource: While we’re discussing data integration, you might find my guide on company secretarial software helpful for unifying data.
Plan for IT resources to manage performance, integrate various data sources, and potentially acquire supplementary software for specialized needs.
3. Training & Change Management
User adoption needs proactive support.
The learning curve for Spotfire can be steeper, especially for users leveraging advanced analytics and custom visualizations. From my analysis, successful change management hinges on dedicated training to empower power users and ensure broader organizational adoption beyond basic reporting.
Invest in comprehensive training programs and identify internal champions to foster widespread adoption and unlock the platform’s full potential.
4. Support & Success Factors
Vendor support is a key differentiator.
Spotfire’s customer support is generally well-regarded, providing responsive and helpful service, especially for enterprise clients. What I found about deployment is that active community contributions enhance overall utility by offering additional connectors and shared knowledge beyond core vendor support.
Prioritize clear communication with support and leverage the community to ensure a smooth implementation and ongoing success with complex use cases.
Implementation Checklist
- Timeline: Weeks for small, months for large organizations
- Team Size: Data analysts, IT support, project manager
- Budget: $5,000 to $50,000+ depending on scale
- Technical: Large dataset handling, varied data source integration
- Success Factor: Comprehensive user training for advanced features
The overall Spotfire setup requires a clear understanding of its powerful capabilities and commitment to maximizing its analytical potential.
Bottom Line
Spotfire: Is it the right fit for you?
This Spotfire review synthesizes my analysis to provide a clear, decisive recommendation, helping you understand its value proposition and who it best serves.
1. Who This Works Best For
Data-intensive enterprises requiring deep analytical insights.
Spotfire excels for organizations like healthcare, manufacturing, energy, and financial services that need advanced visual analytics, predictive modeling, and real-time data processing. From my user analysis, your business will thrive with complex, industry-specific problems that go beyond basic reporting, leveraging AI-powered insights for critical decision-making.
You’ll see significant success if your team includes data scientists or analysts who need to explore large, complex datasets quickly and efficiently.
2. Overall Strengths
Unmatched advanced analytics and visualization capabilities.
The software succeeds by handling massive, complex datasets with exceptional interactive visualizations, offering powerful predictive and statistical modeling without extensive coding. From my comprehensive analysis, its ability to integrate R and Python code makes it a powerhouse for technical users seeking deep customization and advanced analysis.
These strengths will directly enhance your organization’s ability to uncover hidden patterns and make data-driven decisions at an accelerated pace.
3. Key Limitations
Steeper learning curve and potentially higher costs.
While powerful, new users may face an initial adjustment period to master its advanced features, and the named user licensing model can become expensive for large teams. Based on this review, some specific real-time data sources may require additional TIBCO products for seamless integration, adding to potential complexity.
I find these limitations manageable if your team is dedicated to advanced analytics and the ROI justifies the investment.
- 🎯 Bonus Resource: If you’re also looking for best Dex software for seamless SaaS growth, check out my guide.
4. Final Recommendation
Spotfire receives a strong recommendation for specific use cases.
You should choose this software if your enterprise demands sophisticated visual data science, complex predictive modeling, and real-time data analysis. From my analysis, your success depends on your organization’s commitment to advanced analytical capabilities and a willingness to invest in comprehensive training for your power users.
My confidence level is high for data-intensive organizations, but consider alternatives if your priority is basic reporting or budget-friendliness.
Bottom Line
- Verdict: Recommended for enterprises with advanced analytics needs
- Best For: Data scientists and analysts in data-intensive industries
- Business Size: Mid-to-large enterprises handling complex, real-time datasets
- Biggest Strength: Advanced visual analytics and predictive modeling capabilities
- Main Concern: Steeper learning curve and higher licensing costs for large deployments
- Next Step: Request a demo to assess its fit for your specific data challenges
This Spotfire review shows strong value for the right business profile, while also highlighting the learning curve and cost considerations for advanced data science.


