
Drowning in spreadsheets and scattered data sets?
If you are like many business managers or analysts, you know that pulling together reports from various sources can eat up your day. Even worse, it gets frustrating when existing tools feel clunky, give you inconsistent numbers, or need technical skills you just do not have.
So you want a better way. Something that takes the hassle out of reporting and gets everyone on the same page, fast.
In fact, Ventana Research uncovered that organizations spend about two full days each month manually preparing reports. That is a lot of lost time that could be driving actionable insights and growth.
This is where smart reporting tools come in to help you bridge that gap and turn raw data into powerful stories your stakeholders will actually understand.
In this article, I am going to show you the best reporting tools available for streamlining analytics and automating report creation.
You will discover solutions designed for easy data integration, slick visualizations, and the kind of automation that finally saves you hours.
Let’s get started.
Quick Summary:
| # | Software | Target Users |
|---|---|---|
| 1 | Tableau ↗ | Business leaders and analysts needing trusted insights |
| 2 | Domo ↗ | Business leaders needing quick, insightful data access |
| 3 | Sisense ↗ | Data-driven pros seeking fast, easy AI analytics |
| 4 | Power BI ↗ | Data analysts and managers needing easy, real-time reports |
| 5 | Qlik ↗ | Analysts and leaders wanting interactive, AI-driven insights |
1. Tableau
Is making confident data-driven decisions a challenge for you?
Tableau addresses this by turning your complex data into clear and trusted insights that anyone in your organization can understand.
With built-in AI and machine learning, Tableau helps you ask better questions and get smarter answers quickly. It reduces the struggle of analyzing data by enabling a smooth exploration flow without stopping your thoughts.
Its flexibility means you can deploy Tableau where you want—whether on-premises, in the cloud, or integrated with Salesforce CRM. This ensures you stay connected to all your data sources while maintaining proper governance and data management.
Tableau also supports collaboration and storytelling, so your team can share findings and act on insights collectively.
Another standout feature is Tableau Agent, an AI assistant that accelerates your analytics by preparing data and creating visualizations through simple conversation. This is perfect for users who want results without heavy technical skills.
This platform not only helps analysts but business leaders and IT teams deliver data that sparks innovation, improves operations, and enhances customer service.
Key features:
- AI-powered analytics: Built-in AI and machine learning guide you to smarter, faster, and more accurate data explorations and decisions.
- Flexible deployment options: Deploy on cloud, on-premises or natively integrate with Salesforce CRM to access all your data securely while maintaining governance.
- Collaborative data storytelling: Easily share insights and dashboards to align your team and speed up decision-making across departments.
Learn more about Tableau features, pricing, & alternatives →
Verdict:
Tableau stands out as one of the best reporting tools for professionals looking to turn data into results. Its agentic analytics features helped Jaguar Land Rover deliver £250M in business value, showing how its AI-driven insights enable smarter decision-making for business leaders and analysts alike.
2. Domo
Want to turn complex data into clear decisions?
Domo centralizes and simplifies data access by connecting to any source.
Its drag-and-drop ETL tools make preparing your data easier, so you don’t waste time wrestling with complex integrations or scattered information. You can transform and enrich your data right where it lives, whether in your cloud data warehouse or within the platform itself.
This boosts productivity.
Sharing insights becomes simple with interactive dashboards and reports that anyone on your team can access anytime, helping you make smarter business moves without bottlenecks.
Domo’s AI-powered agents take things a step further by automating workflows and providing personalized insights through conversational AI. These AI assistants help you spot trends, forecast outcomes, and handle routine tasks so you can focus on what really matters.
Security is top priority.
Domo ensures your data interactions stay secure and compliant, using built-in governance frameworks and proactive alerts to help you reduce risks and maintain data quality across your organization.
Key features:
- Centralized data integration from any source: Connects your cloud, on-premise, and third-party apps effortlessly, eliminating data silos and ensuring you work from one trusted source of truth.
- AI-powered automation and conversational insights: Automate repetitive tasks and get personalized answers from your data anytime, empowering faster, smarter business decisions.
- Robust security and governance: Built-in controls and alerts safeguard compliance and maintain high data quality, reducing costly errors and risks for your business.
If you want to see how data search can enhance organizational knowledge sharing further, check out the best enterprise search software for more options.
Learn more about Domo features, pricing, & alternatives →
Verdict:
Domo is a strong contender among the best reporting tools for business leaders who need quick, insightful data access. Its mix of easy data prep, AI automation, and secure sharing helped companies like Cenegenics shift to performance-driven decisions, saving hundreds of manual hours during forecasting. Domo stands out for delivering reliable insights with less hassle.
For those focused on agricultural data, you might also want to look at agriculture software solutions tailored for farming operations.
3. Sisense

Looking for smarter ways to turn data into action?
Sisense offers an AI-powered analytics platform designed to simplify modeling, visualization, and integration of your data. It helps you get insights without the usual technical headaches.
This platform is built to bridge the gap between raw data and real-world decisions by embedding AI-driven analytics right where you work. Sisense Intelligence uses natural language tools, so even non-tech users can explore data and get quick, auto-generated summaries.
Embed analytics with ease.
Developers can leverage Compose SDK and embeddable components to integrate AI-powered reports into any app without needing data science expertise or clunky workarounds. This means smarter products and less development hassle for you.
Sisense also helps you stay ahead with predictive analytics that forecast trends, uncover patterns, and spot anomalies early. It lets you move beyond traditional reporting to anticipate what’s next and make proactive choices.
It’s a flexible solution that empowers both technical and non-technical users, making data-driven decisions accessible to your whole team.
Key features:
- AI-powered analytics platform that simplifies data modeling and visualization for faster insights without relying on specialized skills.
- Flexible embed capability with Compose SDK to integrate analytics seamlessly into any application, enhancing user experience and decision-making.
- Predictive analytics tools that help you anticipate trends and identify anomalies to support proactive business strategies.
Learn more about Sisense features, pricing, & alternatives →
Verdict:
Sisense ranks among the best reporting tools for data-driven professionals who want to unlock insights quickly and effectively. Its AI-powered self-service analytics helped companies like Barrios deliver real-time dashboards securely, improving decision speed and agility across teams.
4. Power BI
Is your data telling the full story?
Power BI helps you bring multiple data sources together in one place.
It empowers you to create interactive reports and dashboards with ease. This helps you uncover insights quickly and make smarter decisions without needing advanced technical skills.
You get real-time data refresh to keep your reports always up to date.
It’s designed to give you compelling visualizations, so you can spot trends you might otherwise miss.
Power BI also connects with hundreds of data sources, helping you pull from wherever you store your information.
The drag-and-drop interface means you spend less time wrestling with complex tools and more time diving into your data.
It’s great for data analysts, business managers, and anyone who needs to turn raw data into clear, actionable insights.
Key features:
Unified data connectivity: Easily combine data from Excel, cloud services, on-premises databases, and more to get a complete picture across your business.
Interactive and customizable reports: Build visual reports with drag-and-drop simplicity, enabling faster data exploration and decision making for non-technical users.
Real-time dashboard updates: Monitor your business health with live data refresh that helps you react quickly to changes and opportunities to keep your projects on track.
Learn more about Power BI features, pricing, & alternatives →
Verdict:
Power BI stands out among the best reporting tools by making data analysis accessible and visually impactful. Its ability to unify multiple sources and deliver real-time insights helped organizations improve decision-making. If you want an easy, powerful way to transform your numbers into clear actions, Power BI is a solid choice.
5. Qlik
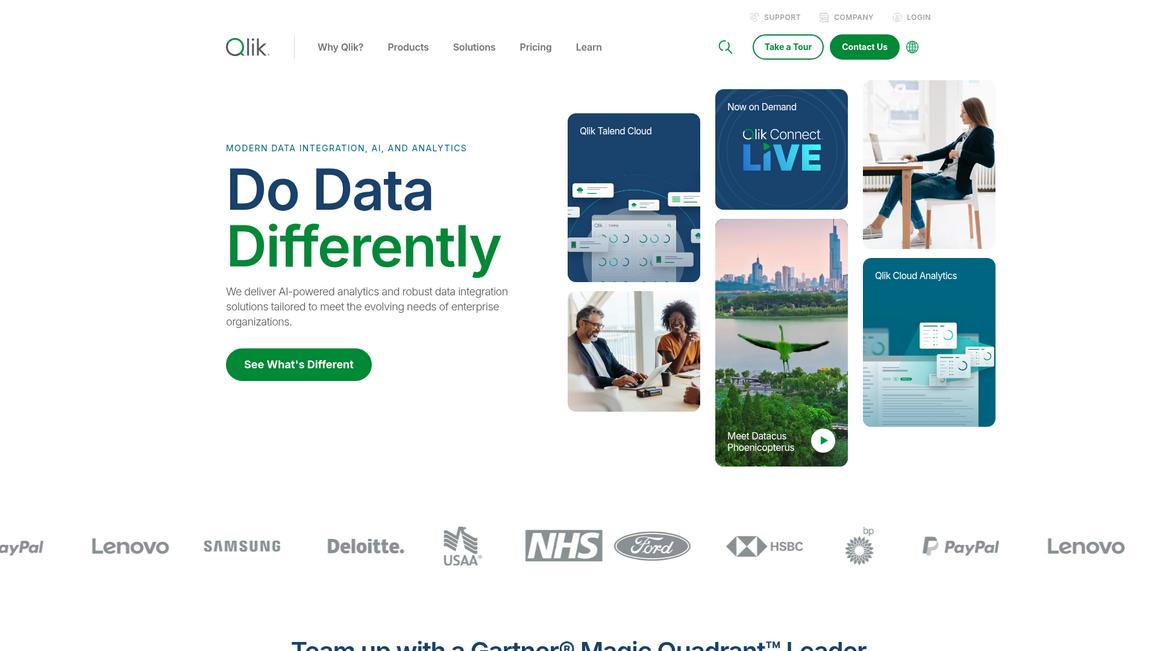
Need clearer insights to make smarter decisions?
Qlik’s associative engine empowers you to explore data without limits, connecting all your information for better understanding.
With Qlik, your team moves beyond static reports to interactive, self-service analytics, uncovering hidden relationships that traditional tools miss. It means no more guesswork or piecing together data from separate sources.
This is analytics reimagined.
You get a unified view of your data across systems, breaking down silos so insights are accessible whenever you need them.
Qlik’s AI and machine learning features help by surfacing the most important trends and anomalies automatically, making your data analysis smarter and more guided.
No need to wait for reports—Qlik lets you visualize your data and drill down instantly, so decisions can be made based on real-time, trustworthy information.
Key features:
- Associative data engine connects all your data sources, so you can explore relationships freely and spot insights others overlook.
- AI-driven insights and suggestions support confident decisions, reducing the time spent sifting through complex datasets without missing critical trends.
- Self-service analytics empower your team, enabling anyone to create visualizations and reports easily without relying on IT or data experts.
Learn more about Qlik features, pricing, & alternatives →
Verdict:
Qlik stands out among the best reporting tools for data analysts and business leaders aiming to turn data into actionable decisions quickly. Its associative engine helped a global company improve decision speed and accuracy, showing the power of combining all data sources intuitively. This makes Qlik a smart choice when you want flexible, AI-backed reporting at your fingertips.
6. Looker

Looking to turn your data into trustworthy insights?
Looker offers an API-first platform that builds a unified, governed data layer for your entire business. It ensures your metrics stay consistent across teams and tools so you can trust every report you use.
Its semantic modeling layer is like a single source of truth, making data accessible without confusion or conflicting numbers. This lets everyone from analysts to business users explore real-time dashboards with confidence and discover answers themselves.
Looker empowers your team to work smarter.
The tool’s AI-powered assistant, Gemini, helps you build reports and visualizations effortlessly, speeding up analysis even if you’re not an expert.
You can also embed Looker’s interactive dashboards directly into your apps or websites, giving customers or partners secure access to tailored data experiences without switching platforms.
Looker is a powerhouse for businesses seeking governed self-service analytics with collaboration built in, whether you’re analyzing marketing campaigns or cloud costs. Its integration with Google Cloud products like BigQuery means massive datasets are handled robustly under the hood, delivering performance without hassle. The platform works with over 800 data sources, so you’re never stuck with limited options.
Key features:
- Unified semantic modeling layer that ensures consistent, trusted data across all teams, eliminating confusion in reports for clearer, faster decision-making.
- AI-powered Gemini assistant that simplifies report building and data exploration, enabling you to create insights without deep technical skills.
- Robust embedded analytics & APIs to integrate interactive dashboards into apps, enhancing external data monetization and user engagement securely.
Learn more about Looker features, pricing, & alternatives →
Verdict:
Looker shines as one of the best reporting tools for business analysts and decision makers who want reliable, governed data they can explore independently. By combining Google’s AI models with a trusted semantic layer, it helped major customers reduce inaccuracies and accelerate insights at scale. If you want enterprise-ready analytics that also empower casual users, Looker is a solid choice.
Conclusion
Reporting can feel overwhelming, can’t it?
I understand the frustration of sifting through countless data sources only to end up with inconsistent reports. This is an issue many of us face. In fact, research by Ventana indicates that organizations lose out on about two days each month just preparing reports manually. That’s a significant chunk of time that could be spent on strategic decision-making.
So, how can you tackle this headache?
That’s where Tableau steps in, offering a streamlined way to convert complex data into clear, actionable insights. It not only fosters collaboration but also enhances data storytelling within your team. With its built-in AI, Tableau enables you to make data-driven decisions effortlessly.
If you’re ready to elevate your reporting game, I highly recommend you start a free trial of Tableau.
By taking this step, you’ll transform how your team interacts with data, ensuring decisions are backed by reliable insights and ultimately driving growth.

