Conflicting data drives everyone crazy.
If you’re evaluating BI tools, you’re likely struggling to get one reliable answer from piles of conflicting spreadsheets and disconnected dashboards.
It’s a real pain when everyone argues over whose numbers are right, and that daily confusion slows down your business decisions.
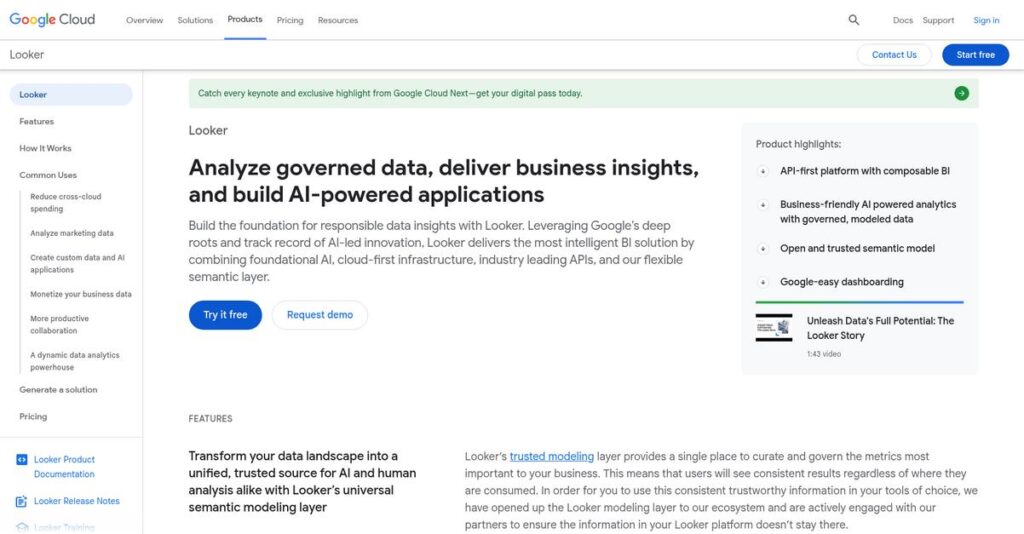
Looker takes a model-driven approach, using LookML to create a trustworthy “single source of truth”, so your team always pulls accurate, consistent insights—no more wasted time second-guessing reports.
In this review, I’ll walk you through how Looker actually delivers on consistent, governed data and why it stands out from the BI crowd.
We’ll dig into its core features, pricing, data modeling setup, embedded analytics, and how it really compares to Tableau and Power BI in this Looker review.
You’ll get the features you need to choose confidently and see if Looker can finally fix your reporting headaches.
Let’s get started.
Quick Summary
- Looker is a cloud-native business intelligence platform that transforms raw data into reliable, actionable insights using a unique data modeling language.
- Best for mid-market and enterprise companies committed to data governance and self-service analytics across many users.
- You’ll appreciate its centralized LookML modeling that ensures consistent metrics and reduces dependence on technical teams for reporting.
- Looker offers custom enterprise pricing with no public free trial, typically requiring contact for quotes and can be costly for smaller businesses.
Looker Overview
Looker has been around since 2012, based in Santa Cruz, California. I find their mission is refreshingly clear: make business data genuinely useful for your daily decisions.
- 🎯 Bonus Resource: Speaking of secure growth for your business, you might find my guide on Cryptocurrency Custody Software helpful.
What really sets them apart is their focus on data-mature organizations that require a truly governed analytics platform. This appeals most to mid-market and enterprise teams tired of dealing with inconsistent reports coming from different departments across the business.
The pivotal moment was Google’s 2019 acquisition. As we’ll explore through this Looker review, its deep integration into the Google Cloud Platform was a total game-changer for them.
Unlike competitors like Tableau that lead with pure visualization, Looker’s unique approach centers on its powerful LookML modeling language. This creates a governed “single source of truth” that feels like it was built by data teams who actually demand absolute consistency.
They work with many well-known digital-native companies and established enterprises. You’ll often see them deployed in tech, media, and e-commerce sectors that depend entirely on having reliable data.
Lately, I’ve noticed their strategy pushing beyond just simple dashboards. Their focus on embedded analytics and workflow integrations helps you put actionable insights directly into the platforms your team already uses every day.
Now let’s examine their capabilities.
Looker Features
Tired of inconsistent data and unreliable insights?
Looker features are designed to help you explore, analyze, and share real-time data insights, acting as your organization’s single source of truth. These are the five core Looker features that transform your data analysis.
1. LookML Data Modeling
Struggling with inconsistent data definitions?
When different teams use varying metrics for the same data, it leads to confusion and distrust in reports. This slows down decision-making significantly.
LookML, Looker’s proprietary language, allows you to define data relationships and business logic once, ensuring consistency across all reports. From my testing, this feature truly shines in maintaining a “single source of truth,” which empowers users to explore data confidently without deep SQL knowledge.
This means you can finally trust your data, knowing every report uses the same, accurate calculations.
2. Interactive Dashboards and Reports
Can’t get real-time insights from your static reports?
Outdated or non-interactive dashboards often hide crucial trends and prevent timely responses to market changes. This leaves you guessing about performance.
Looker’s interactive dashboards deliver real-time data visualizations, allowing you to filter, drill down, and ask new questions on the fly. Here’s what I found: you can easily explore data to row-level details, which is critical for truly understanding underlying patterns.
The result is your team gets dynamic, actionable insights that enable quick, informed strategic decisions.
3. Data Exploration (“Explores”)
Are business users constantly asking IT for ad-hoc reports?
Relying on technical teams for every data question creates bottlenecks and slows down departments. This makes your team less agile.
Looker’s “Explores” feature provides a user-friendly interface for self-service analytics, empowering non-technical users to build their own queries. What I love about this approach is how anyone can drag and drop fields to create insights without writing any SQL, freeing up your data team.
So as a business user, you can quickly answer your own data questions, accelerating decision-making across the board.
- 🎯 Bonus Resource: While we’re discussing accelerating impact for your business, finding the best Oracle partner is equally important for your goals.
4. Embedded Analytics
Want to bring data insights directly into your products?
If your customers or employees need to leave your application to see their data, it creates a clunky and disjointed user experience.
Looker allows you to embed powerful dashboards and reports directly into external applications, providing a seamless data experience. This is where Looker gets it right: you can integrate real-time usage statistics or performance metrics right into your customer-facing portals or internal tools.
This means you can significantly enhance your product’s value and boost customer engagement and retention.
5. Workflow Integrations
Is your data sitting in a silo, separate from your operations?
Analyzing data is great, but if insights don’t lead to action within your daily tools, their impact is limited. This creates a gap between insight and execution.
Looker integrates with popular business applications like Slack, HubSpot, and MailChimp, allowing you to operationalize your data insights. You can set up automated alerts to notify your team in Slack when key metrics change, driving immediate action.
This helps you bridge the gap between analysis and operation, ensuring data drives tangible business outcomes.
Pros & Cons
- ✅ LookML provides a robust, consistent single source of truth for metrics.
- ✅ Empowers business users with strong self-service data exploration capabilities.
- ✅ Offers real-time interactive dashboards for dynamic, up-to-date insights.
- ⚠️ Steeper learning curve for technical users setting up LookML models.
- ⚠️ Initial setup and data modeling require significant SQL expertise.
- ⚠️ Can be cost-prohibitive for smaller businesses, especially embedded use.
All these Looker features work together to create a comprehensive data analytics ecosystem that transforms raw data into actionable knowledge.
Looker Pricing
Unsure what your final bill will actually be?
Looker pricing is highly customized, often requiring direct consultation with their sales team to understand the cost structure that fits your unique needs.
Cost Breakdown
- Base Platform: Starting around $35,000 per year, up to $1,770,000 for large enterprises
- User Licenses: Viewer: ~$30/user/month; Developer: ~$125/user/month
- Implementation: Varies by complexity, often included in custom quote
- Integrations: Varies by complexity; API expansions: $500–$1,000 per 10,000 calls
- Key Factors: Number of users, data volume, features, custom dashboards, API usage
1. Pricing Model & Cost Factors
Their custom pricing is complex.
Looker operates on a custom quote model, meaning there are no public tiers or fixed prices available. What I found regarding pricing is that costs depend heavily on user types (Viewer, Standard, Developer), data volume, and specific features like custom dashboards or advanced analytics.
From my cost analysis, this means your total bill directly reflects your usage intensity and feature requirements.
- 🎯 Bonus Resource: Before diving deeper, you might find my analysis of best plumbing software helpful.
2. Value Assessment & ROI
Does the cost justify the value?
Looker’s emphasis on a single source of truth via LookML can significantly improve data consistency, reducing analytical errors and saving time. From my cost analysis, this translates to measurable ROI through better decision-making and operational efficiency for your business.
This means your budget goes towards a solution that directly impacts your ability to derive actionable insights.
3. Budget Planning & Implementation
Anticipate the full cost picture.
Beyond the annual subscription, consider additional costs like custom dashboard design ($100-$200/developer hour) and potential API expansions. Budget-wise, what I’ve seen is that implementation services and ongoing support also contribute to your total cost of ownership.
So for your business, you’ll need to factor in all these elements to understand your true investment.
My Take: Looker’s custom pricing targets mid to large enterprises, offering tailored solutions that justify the higher investment through robust data governance and powerful analytical capabilities for serious data users.
The overall Looker pricing reflects a strategic investment for comprehensive data intelligence.
Looker Reviews
What do real customers actually think?
To help you understand what real users experience, I’ve analyzed numerous Looker reviews to provide balanced insights on its strengths and weaknesses.
1. Overall User Satisfaction
Most users are genuinely satisfied.
From my review analysis, Looker generally receives very positive feedback, often praised for its powerful data insights and intuitive interface. What I found in user feedback is how users appreciate its clean design and responsive support, indicating a high level of overall contentment.
This suggests you can expect a largely positive experience with Looker.
- 🎯 Bonus Resource: While we’re discussing different types of software, understanding niche solutions like fire department software is equally important.
2. Common Praise Points
Users consistently love the data modeling.
Customers frequently praise Looker’s LookML for enabling consistent data definitions, establishing a “single source of truth.” What stands out in customer reviews is how LookML allows robust data governance, ensuring everyone works with reliable data.
This means you can expect data consistency and empowered self-service analytics for your team.
3. Frequent Complaints
Steeper learning curve is a common frustration.
While great for business users, many reviews highlight Looker’s steeper learning curve for technical users, particularly with LookML setup. What stands out is how initial setup requires significant SQL expertise, posing a challenge for some teams.
These issues are generally manageable with proper technical resources and planning.
What Customers Say
- Positive: “End users feel like they own their data and data is integrated with the decisions and what they are doing daily. That is just as powerful as the time savings that goes with it.”
- Constructive: “Although end-users don’t need to write SQL, the initial setup and data modeling in LookML require technical expertise and understanding of SQL.”
- Bottom Line: “Best BI tool for self-service analytics if you have the right technical talent for initial setup.”
The overall Looker reviews reflect strong capabilities with a notable setup investment.
Best Looker Alternatives
Choosing the right BI tool can be tricky.
The best Looker alternatives include several strong options, each better suited for different business situations, technical requirements, and budget constraints. Let’s explore when each might be a better fit.
- 🎯 Bonus Resource: Speaking of diverse business needs, my article on pilates studio software explores how specialized solutions address niche markets effectively.
1. Tableau
Prioritizing ease of use for visual analytics?
Tableau excels when your organization prioritizes intuitive visual analytics and user-friendly dashboards for non-technical users. From my competitive analysis, Tableau offers highly customizable and visually rich dashboards, providing a strong alternative for visual data exploration.
Choose Tableau if your team prefers visual exploration and needs a flexible, accessible tool for diverse data environments.
2. Microsoft Power BI
Already in the Microsoft ecosystem?
Power BI makes sense if your team heavily relies on Microsoft products, as it offers seamless integration and a lower learning curve for basic use. What I found comparing options is that Power BI provides extensive data connectivity at a lower cost, making it a budget-friendly alternative.
Consider Power BI when budget is a primary concern, or your team is less technical and deeply integrated with Microsoft.
3. Qlik Sense
Uncovering hidden data relationships?
Qlik Sense is ideal if your organization values a powerful associative engine for free-form data exploration without query limitations. From my analysis, Qlik Sense excels at uncovering hidden data relationships, providing a unique way to understand complex datasets.
Choose Qlik Sense when intuitive data exploration and robust ETL capabilities are critical for your business.
4. Domo
Connecting to a vast array of data sources?
Domo stands out if your business needs to integrate data from an extensive library of diverse sources, boasting over 1,000 pre-built connectors. Alternative-wise, Domo offers unmatched data connectivity for varied sources, providing a comprehensive solution for disparate data.
Opt for Domo when integrating a very wide variety of data sources is your top priority, alongside user-friendliness.
Quick Decision Guide
- Choose Looker: Centralized data modeling and real-time exploration
- Choose Tableau: Intuitive visual analytics for non-technical users
- Choose Microsoft Power BI: Microsoft ecosystem integration and budget-friendly
- Choose Qlik Sense: Uncovering hidden data relationships and ETL capabilities
- Choose Domo: Extensive data connector library for diverse sources
The best Looker alternatives ultimately depend on your specific business needs and technical capabilities, not just feature lists.
Looker Setup
How complex is a Looker implementation?
A Looker review reveals that while powerful, its deployment approach and complexity vary significantly based on your data ecosystem and internal resources. This section sets realistic expectations.
1. Setup Complexity & Timeline
This isn’t an instant analytics solution.
- 🎯 Bonus Resource: Speaking of tools that empower creativity, you might find my guide on music notation software useful.
Looker’s setup involves defining data sources and modeling with LookML, which demands SQL and data modeling expertise. From my implementation analysis, initial data modeling is the biggest time investment, taking months for complex organizations, while simpler setups might be quicker.
You’ll need a dedicated data team or external expertise to define data relationships properly before deriving insights.
2. Technical Requirements & Integration
Expect specific technical prerequisites and integration work.
Looker is cloud-native, connecting directly to your existing databases and data warehouses, like BigQuery or Snowflake, for live querying. What I found about deployment is that it requires robust, scalable relational databases for optimal performance, rather than local installations.
Plan for strong IT readiness to manage database connections and ensure your data infrastructure is up to par.
3. Training & Change Management
User adoption requires proactive training.
While Looker’s drag-and-drop interface is user-friendly, business users need training to effectively use “explores” and interpret data. From my analysis, successful adoption hinges on a clear training strategy to help users leverage self-service analytics and understand data models.
Invest in Looker University or internal training programs to ensure your team maximizes the platform’s potential and embraces data-driven decision-making.
Implementation Checklist
- Timeline: 3-12 months depending on data complexity
- Team Size: Dedicated data engineers/analysts plus IT support
- Budget: Professional services for LookML development and training
- Technical: Scalable relational database and data warehouse
- Success Factor: Robust data modeling and strong internal training
Overall, a successful Looker setup requires significant upfront data preparation and commitment to overcome its learning curve but yields substantial long-term ROI.
Bottom Line
Should Looker be your next BI platform?
This Looker review synthesizes comprehensive analysis to provide a clear recommendation, helping you understand its value proposition and make an informed decision for your business.
1. Who This Works Best For
For organizations committed to becoming truly data-driven.
Looker works best for mid-market and enterprise companies with dedicated data teams seeking robust data governance and self-service analytics for broad user bases. What I found about target users is that organizations leveraging the Google Cloud ecosystem will find particularly seamless integration and enhanced capabilities within this environment.
You’ll succeed if your goal is to empower all users with data insights while maintaining a single source of truth for critical metrics.
- 🎯 Bonus Resource: While we’re discussing organizations committed to growth, understanding the best tools for empowering expansion, such as best MLM software, is equally important.
2. Overall Strengths
Looker offers unparalleled data governance and consistency.
The software succeeds by enabling self-service analytics through its LookML data modeling, ensuring a “single source of truth” and significantly reducing reliance on technical teams. From my comprehensive analysis, its real-time data capabilities accelerate decision-making by providing instant access to fresh insights.
These strengths allow your business users to own their data, fostering a truly data-driven culture and boosting overall productivity.
3. Key Limitations
Initial setup requires significant technical expertise.
While powerful, Looker’s LookML data modeling has a steeper learning curve for technical users responsible for initial setup and ongoing maintenance. Based on this review, the pricing can be a significant concern, particularly for smaller businesses or extensive embedded analytics use cases due to high viewer costs.
These limitations indicate that Looker demands a strong internal data team and a substantial budget, making it less suitable for organizations without those resources.
4. Final Recommendation
Looker earns a strong recommendation for the right fit.
You should choose this software if your organization prioritizes strong data governance, real-time insights, and empowering a wide range of business users with self-service analytics. From my analysis, your commitment to building a data-driven culture will be amplified by Looker’s robust capabilities.
My confidence level is high for large, data-mature organizations, but I recommend caution for budget-constrained smaller teams.
Bottom Line
- Verdict: Recommended with reservations for specific business contexts
- Best For: Mid-market and enterprise companies prioritizing data governance
- Business Size: Organizations with significant data volumes and dedicated data teams
- Biggest Strength: Governed real-time data insights via LookML data modeling
- Main Concern: Steeper learning curve for setup and potentially high pricing
- Next Step: Contact sales for a demo to assess technical requirements and pricing
This Looker review highlights its strong value for data-driven enterprises, while also emphasizing the necessary technical investment and budget considerations for your decision.


