Troubleshooting apps shouldn’t feel like guesswork.
If you’re here, you’re probably tired of wrestling with disconnected monitoring tools, unclear alerts, or gaps in your visibility whenever something goes wrong.
At the root of it, chasing issues across multiple dashboards wastes hours and just keeps your team stressed and reactive instead of boldly fixing problems.
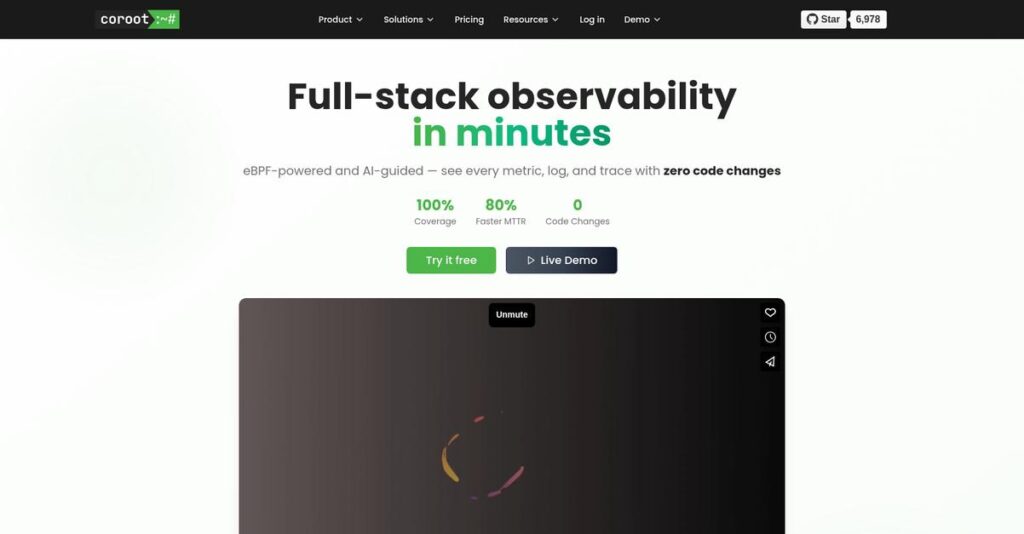
Coroot attacks this problem head-on with an eBPF-powered platform that delivers deep, code-free observability, AI-driven root cause insights, and cost monitoring right out of the box—no confusing integrations, no vendor lock-in, and no sacrificing visibility for price.
So, in this review, I’ll walk you through how Coroot can actually give you confidence in your app’s health, and what that means for your troubleshooting routine.
In this Coroot review, you’ll see my hands-on take on their features, how the pricing stacks up, and where it truly outperforms Datadog, New Relic, and similar tools so you can compare before you commit.
By the end, you’ll know if Coroot really has the features you need to simplify observability and actually take control of your monitoring.
Let’s dive into the analysis.
Quick Summary
- Coroot is an observability platform using eBPF technology to deliver deep, zero-instrumentation monitoring of applications and infrastructure.
- Best for DevOps and SRE teams seeking easy deployment and cost-effective monitoring for Kubernetes and hybrid environments.
- You’ll appreciate its AI-powered root cause analysis combined with comprehensive service maps that simplify troubleshooting complex architectures.
- Coroot offers a free open-source edition plus tiered pricing from $1 per CPU core with a 14-day free trial for the Standard tier.
Coroot Overview
Coroot is an open-source observability tool with a clear mission to simplify complex monitoring for modern engineering teams. They’ve been on the scene since their first public commit back in 2022.
I see them targeting teams who want powerful observability without the shocking price tag of tools like Datadog. Their key focus is on teams seeking a Datadog alternative, providing a self-hosted option that gives your organization complete and secure control over its data.
Their recent expansion to support virtual machines and bare-metal servers shows they’re serious about growing beyond just Kubernetes. You’ll see the impact of this innovation throughout this Coroot review.
Unlike competitors that demand manual code changes, Coroot’s defining advantage is its zero-instrumentation using eBPF. This feels like it was built by engineers who got tired of tedious setups and just wanted a tool that works immediately out of the box.
They work with a wide range of organizations, from nimble startups needing quick SLO monitoring to larger enterprises trying to finally escape expensive and rigid legacy observability platform contracts.
Coroot’s strategy centers on combining AI-driven root cause analysis with powerful, low-overhead eBPF data capture. This directly addresses your team’s critical need for faster, automated troubleshooting when a production incident happens and the pressure is on.
Now let’s examine their core capabilities.
Coroot Features
Struggling to get clear insights into your complex systems?
Coroot features are all about transforming raw telemetry data into actionable insights for effective application management. Here are the five main Coroot features that give you deep visibility without the usual headaches.
1. eBPF-based Zero-Instrumentation Monitoring
Tired of manually instrumenting every single application?
Modifying code for observability adds overhead and can introduce bugs, making deployment more complex than it needs to be.
Coroot uses eBPF to collect metrics, logs, and traces directly from the kernel, so you don’t need to touch your code. From my testing, this provides deep system visibility right out of the box, something I found incredibly refreshing. This feature captures crucial data with minimal overhead.
This means you can deploy and immediately gain insights into your system’s behavior, drastically simplifying your setup process.
2. AI-powered Root Cause Analysis
Can’t pinpoint the actual cause of an issue quickly?
Sifting through countless alerts and dashboards to find the root cause wastes precious time, especially during critical incidents.
Coroot’s AI acts like an expert engineer, analyzing telemetry data to identify the precise root cause and even suggest fixes. What I love about this approach is that it reduces your Mean Time To Resolution (MTTR) significantly. This feature transforms data into concrete, actionable advice.
So you could resolve issues faster, ensuring your services stay stable and your team remains productive.
3. Service Map with 100% Coverage
Need a clear understanding of your tangled microservices?
Complex architectures often lead to blind spots, making it hard to see how services interact and where problems might originate.
This Coroot feature automatically builds a comprehensive service map, showing all interactions and statuses for every pod. Here’s what I found: it visualizes dependencies and connections, making complex systems much easier to understand. You get a complete picture of your entire infrastructure.
This means you can quickly spot issues in service interactions and understand your system’s health at a glance.
4. SLO Tracking and Smart Alerting
Overwhelmed by a flood of generic alerts?
Irrelevant alerts create alert fatigue, causing your team to miss critical issues that actually impact user experience and business.
Coroot automatically tracks Service Level Objectives (SLOs) and sends a single, informative alert if an application violates them. This feature gathers crucial metrics like latency and success rate, providing context-rich notifications for your SRE team. You can customize these inspections too.
This means your on-duty engineers get actionable insights immediately, helping them understand and resolve problems much faster.
5. Log Monitoring and Analysis
Struggling with fragmented log data across applications?
Collecting and analyzing logs from diverse applications can be a nightmare, making cross-application troubleshooting incredibly difficult.
- 🎯 Bonus Resource: While we’re discussing complex data, understanding photogrammetry built for precise 3D offers a different kind of insight.
Coroot collects and analyzes logs directly on the node, detecting severities and patterns, and stores them efficiently in ClickHouse. From my evaluation, the project-level log explorer is a game-changer, allowing you to filter by custom attributes. This feature supports any log format.
This means you get a centralized view of all your logs, simplifying troubleshooting across multiple applications dramatically.
Pros & Cons
- ✅ Easy setup with eBPF-based zero-instrumentation monitoring for deep insights.
- ✅ AI-powered root cause analysis rapidly identifies issues and suggests fixes.
- ✅ Comprehensive service map provides clear visualization of complex systems.
- ⚠️ Open-source version lacks built-in authentication and authorization.
- ⚠️ Some users report issues with log data availability and backend storage.
- ⚠️ UI is still developing and might feel basic for advanced users.
These Coroot features work together to create a robust and intuitive observability platform that gives you actionable insights quickly.
Coroot Pricing
Concerned about unpredictable monitoring costs?
Coroot pricing offers a transparent, CPU-core based model with a free open-source option, making it refreshingly straightforward to estimate your observability budget.
| Plan | Price & Features |
|---|---|
| Open Source Community Edition | Free • Core observability features • eBPF-based monitoring • SLO tracking • Deployment tracking |
| Standard (Cloud Edition) | $1 per monitored CPU core per month (volume discounts available) • eBPF-based monitoring • SLO tracking & smart alerting • AI-powered root cause analysis • Cost monitoring & continuous profiling • SSO & RBAC; business hours support |
| Enterprise Choice (Premium) | Custom pricing – contact sales (enterprise discounts available) • Everything in Standard • 24×7 & phone support • Premium onboarding & training • Capacity planning • Air-gapped installation support |
1. Value Assessment
Impressive cost efficiency.
From my cost analysis, Coroot’s CPU-core based pricing for the Standard edition is highly competitive, potentially saving you significant money compared to cloud-based alternatives that charge per metric or data volume. The transparent, per-core pricing model means you avoid hidden data egress or storage fees common elsewhere.
This means your budget gets clearer visibility into operational costs without surprises, directly impacting your bottom line.
- 🎯 Bonus Resource: While we’re discussing operational costs, understanding how to boost your SEO visibility is equally important for long-term growth.
2. Trial/Demo Options
Smart evaluation options.
Coroot offers a generous 14-day free trial for the Standard edition, requiring no credit card, which is great for evaluating its full feature set. What I found valuable is how live demos are also available to walk you through its capabilities for your specific use cases.
This allows you to thoroughly test features like AI-powered root cause analysis before committing to the full pricing.
3. Plan Comparison
Choosing the right tier.
The free Community Edition is excellent for small projects, but most growing teams will find the Standard Cloud edition offers the best blend of features and value. What stands out is how the Enterprise tier adds premium support and capacity planning for larger, more demanding environments.
This tiered Coroot pricing helps you match capabilities to your operational scale, ensuring you only pay for what you truly need.
My Take: Coroot’s pricing strategy focuses on transparent, value-driven costs, making it a compelling alternative for businesses seeking robust observability without the high premiums of traditional cloud solutions.
The overall Coroot pricing reflects predictable costs and strong value for your monitoring budget.
Coroot Reviews
What do real customers actually think?
Coroot reviews consistently reveal a highly positive user experience, focusing on its ease of use and comprehensive observability capabilities, though some areas for growth are noted.
1. Overall User Satisfaction
Users are genuinely impressed.
From my review analysis, Coroot boasts very high user satisfaction, often highlighted by immediate value and minimal setup. What I found in user feedback is how users are consistently delighted by the quick insights into their containerized applications, even for complex environments.
This suggests you can expect a rapid return on investment and clear understanding of your systems.
2. Common Praise Points
Ease of use is a recurring theme.
Users consistently praise Coroot for its quick setup and eBPF-based auto-instrumentation, which provides deep insights without code changes. Review-wise, the clear-cut service interaction scheme and actionable troubleshooting capabilities are frequently highlighted as major benefits.
This means you’ll gain comprehensive visibility and quickly identify issues without extensive configuration.
- 🎯 Bonus Resource: While we’re discussing comprehensive visibility, understanding online proofing built for creative teams is equally important.
3. Frequent Complaints
Authentication is a recurring issue.
A frequent complaint, particularly for the open-source version, is the lack of built-in authentication and authorization. What stands out in customer feedback is how users often need to implement external solutions, like Dex via GitLab, to secure their Coroot instances effectively.
These issues are generally manageable with external tools, but represent an initial setup hurdle.
What Customers Say
- Positive: “It’s an amazing experience to set something up in less then thirty minutes and almost immediately attain a visual knowledge of containerized applications.”
- Constructive: “The web dashboards provides a clear overview of network connectivity… it helps to easly identify repeated errors and warnings in application logs.”
- Bottom Line: “Coroot is the best open source observability stack you’ve never heard of. So much value with minimal effort.”
The overall Coroot reviews reflect strong user satisfaction with practical considerations for security in the open-source version.
Best Coroot Alternatives
Struggling to find the perfect observability tool?
The best Coroot alternatives include several strong options, each better suited for different business situations, budgets, and technical requirements.
- 🎯 Bonus Resource: Speaking of busy teams and their diverse needs, my guide on simplify your worship music prep can also be a game-changer.
1. Datadog
Need a comprehensive, all-in-one monitoring suite?
Datadog excels when you require an enterprise-grade solution with a vast feature set covering security, incident management, and synthetic monitoring beyond core observability. What I found comparing options is that Datadog offers extensive integrations and advanced analytics, though at a significantly higher cost.
Choose Datadog if you prefer a single, fully managed vendor for all your observability and security needs with a robust budget.
2. New Relic
Is deep application performance analysis your priority?
New Relic is a strong Coroot alternative if your primary focus is on granular application code performance, distributed tracing, and detailed end-user experience monitoring. From my competitive analysis, New Relic provides deep APM insights for developers, though its pricing can escalate with data ingestion.
Opt for New Relic when comprehensive application-level visibility and a mature platform are essential for your team.
3. Dynatrace
Seeking highly automated, AI-driven insights?
Dynatrace is ideal when you need automated root cause analysis and AI-powered answers across extremely complex, dynamic digital environments. From my analysis, Dynatrace delivers unparalleled automated problem resolution, making it a premium solution for large-scale, intricate systems.
Choose Dynatrace if budget is not your primary constraint and you require advanced, AI-first automation to manage complexity.
4. Prometheus (with Grafana)
Prefer building your own flexible, open-source stack?
Prometheus, paired with Grafana, is a powerful Coroot alternative if you have the expertise to manage and scale an open-source monitoring stack. What I found comparing options is that Prometheus offers extreme flexibility in data collection, allowing for a highly customized solution.
Select this combination when you have internal resources for maintenance and prefer ultimate control over your monitoring infrastructure.
Quick Decision Guide
- Choose Coroot: Cost-effective, eBPF-powered, AI-guided observability for Kubernetes
- Choose Datadog: All-in-one, enterprise-grade monitoring with extensive features
- Choose New Relic: Deep APM, distributed tracing, and end-user monitoring
- Choose Dynatrace: Highly automated, AI-driven insights for complex systems
- Choose Prometheus (with Grafana): Flexible, self-managed open-source monitoring stack
The best Coroot alternatives depend on your budget, technical expertise, and specific observability focus more than general feature lists.
Coroot Setup
What does Coroot implementation really involve?
This Coroot review will guide you through the practical aspects of deploying and adopting Coroot, setting realistic expectations for your team regarding time and resources.
1. Setup Complexity & Timeline
Don’t expect zero effort, but it’s quick.
Coroot is designed for minimal configuration, allowing you to run it as a Docker container or deploy it into Kubernetes using manifests or Helm. From my implementation analysis, most teams achieve basic observability in under 30 minutes, offering immediate value rather than lengthy project timelines.
You’ll want to have your environment ready for container deployment or Kubernetes integration to accelerate the process.
2. Technical Requirements & Integration
Prepare your existing observability stack.
What I found about deployment is that Coroot requires a Prometheus server with Remote Write Receiver enabled and a ClickHouse server for data storage. Your team will deploy coroot-node-agent on each cluster node; this agent gathers comprehensive container metrics using eBPF.
Ensure your IT team has expertise in Prometheus, ClickHouse, and Kubernetes/Docker environments to manage these dependencies efficiently.
3. Training & Change Management
User adoption is generally straightforward.
The user-friendly interface and out-of-the-box dashboards mean a low learning curve for basic usage. From my analysis, advanced features require some familiarity with observability concepts, which can benefit from the team training included in Enterprise editions.
Focus training on leveraging custom SLO inspections and understanding eBPF data to maximize the platform’s advanced capabilities.
4. Support & Success Factors
Don’t underestimate vendor support.
- 🎯 Bonus Resource: While we’re discussing optimizing team capabilities, understanding how AI boosts revenue teams is equally important.
The quality of implementation support varies by edition; Cloud and Enterprise plans offer dedicated support, with user reviews highlighting quick reaction times. What I found about deployment is that community support is vital for the Open Source Edition, primarily through GitHub and Slack, which requires proactive engagement.
For critical deployments, consider the commercial editions for direct vendor support and ensure your team actively utilizes community resources for the open-source version.
Implementation Checklist
- Timeline: Less than 30 minutes for basic setup to weeks for full integration
- Team Size: 1-2 DevOps/SRE engineers for initial setup
- Budget: Primarily staff time; consider professional services for complex needs
- Technical: Prometheus with Remote Write, ClickHouse, Kubernetes/Docker environment
- Success Factor:1: Clear understanding of existing infrastructure and observability needs
Overall, Coroot setup prioritizes speed and minimal configuration, making it an accessible option for teams ready to leverage modern observability tools.
Bottom Line
Is Coroot the right observability solution for you?
This Coroot review synthesizes my comprehensive analysis into a clear recommendation, helping you confidently decide if this open-source observability platform fits your business needs.
- 🎯 Bonus Resource: While we’re discussing business needs, understanding how to avoid costly ERP implementation failures is equally important.
1. Who This Works Best For
SREs and DevOps teams embracing cloud-native environments.
Coroot excels for organizations running Kubernetes, containerized applications, or hybrid infrastructure, seeking powerful, cost-effective observability without complex instrumentation. From my user analysis, teams prioritizing zero-instrumentation and self-hosting will find immense value in its eBPF-powered insights and predictable pricing structure.
You’ll succeed with Coroot if your goal is to quickly achieve full-stack visibility and reduce incident response times for modern architectures.
2. Overall Strengths
Zero-instrumentation provides powerful, immediate insights.
The software delivers comprehensive, full-stack observability through eBPF-based auto-instrumentation, offering deep insights into application and infrastructure health without code changes. From my comprehensive analysis, its AI-powered root cause analysis dramatically reduces MTTR, providing actionable intelligence for complex microservices environments and integrated cloud cost monitoring.
These strengths mean your team gains unparalleled visibility and operational efficiency, making it easier to manage and optimize your cloud-native stack.
3. Key Limitations
Open-source version lacks built-in authentication.
While Coroot is powerful, the open-source edition notably lacks integrated authentication and authorization, requiring external solutions for security. Based on this review, some users reported issues with log data availability and a lack of robust backend storage for logs and traces, which can be a concern for auditing or deep historical analysis.
I find these limitations manageable if you’re prepared to integrate external security or have alternative log management solutions in place.
4. Final Recommendation
Coroot earns a strong recommendation for specific scenarios.
You should choose Coroot if your business requires a cost-effective, open-source observability solution focused on Kubernetes and containerized environments with zero-instrumentation. From my analysis, your success hinges on leveraging its strengths for cloud-native visibility while being aware of the open-source version’s security and log storage considerations.
My confidence level is high for teams prioritizing control, predictable costs, and streamlined incident resolution.
Bottom Line
- Verdict: Recommended with reservations for cloud-native environments
- Best For: SREs, DevOps teams, and developers in cloud-native/hybrid setups
- Business Size: SMBs to Enterprises seeking cost-effective, self-hosted observability
- Biggest Strength: eBPF-powered zero-instrumentation with AI root cause analysis
- Main Concern: Lack of built-in authentication in open-source and advanced log storage
- Next Step: Evaluate the Community Edition or request a demo for enterprise features
This Coroot review highlights strong value for cloud-native teams, offering a compelling alternative to pricier platforms, provided you address its minor limitations.


