Drowning in endless spreadsheets?
You spend hours manually pulling data from different systems, trying to piece together a clear picture of your business performance.
This manual grind not only kills productivity but also delays critical business decisions because insights arrive too late to be useful.
This manual approach isn’t just inefficient; it’s risky. All that copying and pasting introduces human errors, creating reports that stakeholders can’t fully trust for strategic planning.
The right tools can solve this, helping you automate report generation entirely. This frees you to focus on strategy instead of tedious compilation.
In this article, I’ll break down the best reporting tools that help you turn messy data into clear, compelling visualizations and actionable dashboards.
You’ll learn how to save countless hours, improve data accuracy, and finally make confident, data-driven decisions that push your business forward.
Let’s get started.
Quick Summary:
| # | Software | Rating | Best For |
|---|---|---|---|
| 1 | Domo → | Medium to large enterprises | |
| 2 | Zoho → | Businesses of all sizes | |
| 3 | Whatagraph → | Marketing agencies | |
| 4 | Tableau → | Analysts and business leaders | |
| 5 | HubSpot → | Sales and marketing teams |
1. Domo
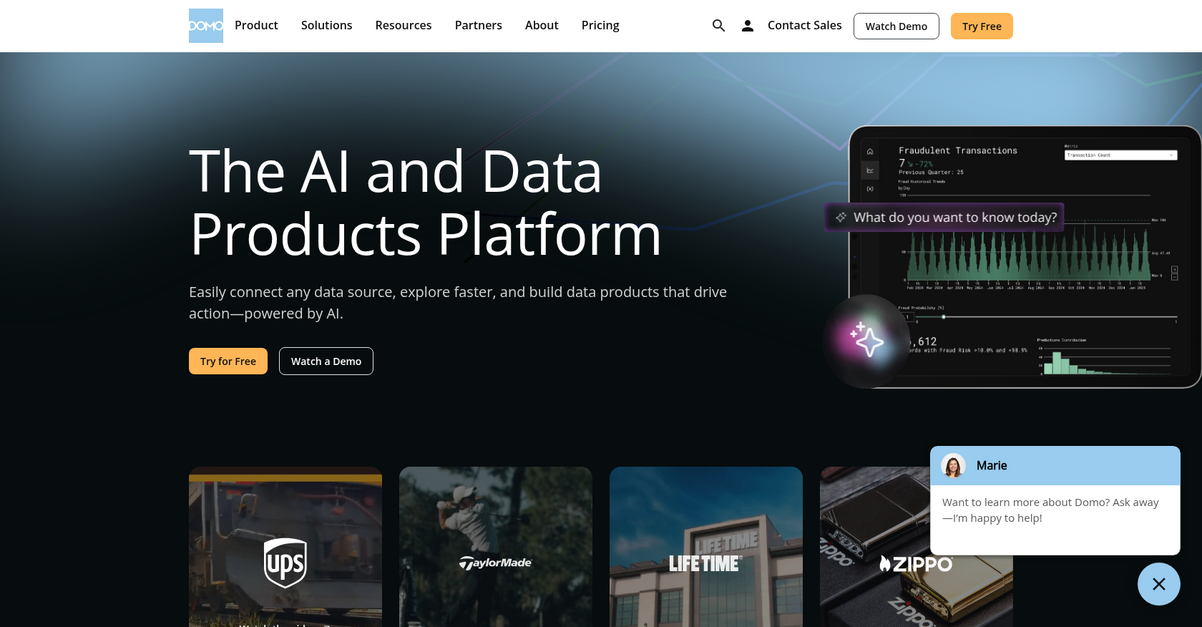
Are you drowning in data, losing critical hours?
Domo connects and prepares data from any source, centralizing information seamlessly. This empowers you to effortlessly transform raw data into actionable insights, without extensive technical know-how. Domo also delivers AI-assisted tools that help you save time. It makes data exploration and sharing immediate, helping your business move forward.
Domo helps you extract maximum value from your data.
Domo streamlines your data workflow by integrating, extending, and automating your data processes. You can connect, centralize, and prepare data from any source, including Salesforce, Excel, and Google Sheets, ensuring your data is always ready for analysis. Then, it lets you explore and share data easily, helping you uncover trends and drive smarter decisions.
Domo’s AI capabilities, like AI Chat, provide conversational insights directly to end-users, automating tasks and adapting dynamically to your business needs. This powerful platform includes features like drag-and-drop ETL for easy data transformation and self-service reporting. It also includes automated alerts to ensure you stay informed and focused on high-impact priorities, enhancing productivity.
You can truly command your data with Domo.
Before diving deeper into Domo’s capabilities, you might find my analysis of best marketing analytics tools helpful for a broader perspective.
Key features:
- Robust Data Integration: Connects and centralizes data from diverse sources like Salesforce and Excel, preparing it for analysis and ensuring data availability.
- AI-Powered Insights: Utilizes secure AI agents and AI Chat to automate tasks and provide personalized, conversational insights for faster decision-making.
- Workflow Automation: Automates operations and reporting processes, reducing manual effort and empowering your organization to work smarter and more efficiently.
Learn more about Domo features, pricing, & alternatives →
Verdict:
Domo excels as one of the best reporting tools, allowing your team to easily integrate disparate data, build powerful visualizations, and automate insights. Its AI capabilities streamline workflows, empowering you to turn data into decisions fast and achieve measurable business growth.
2. Zoho
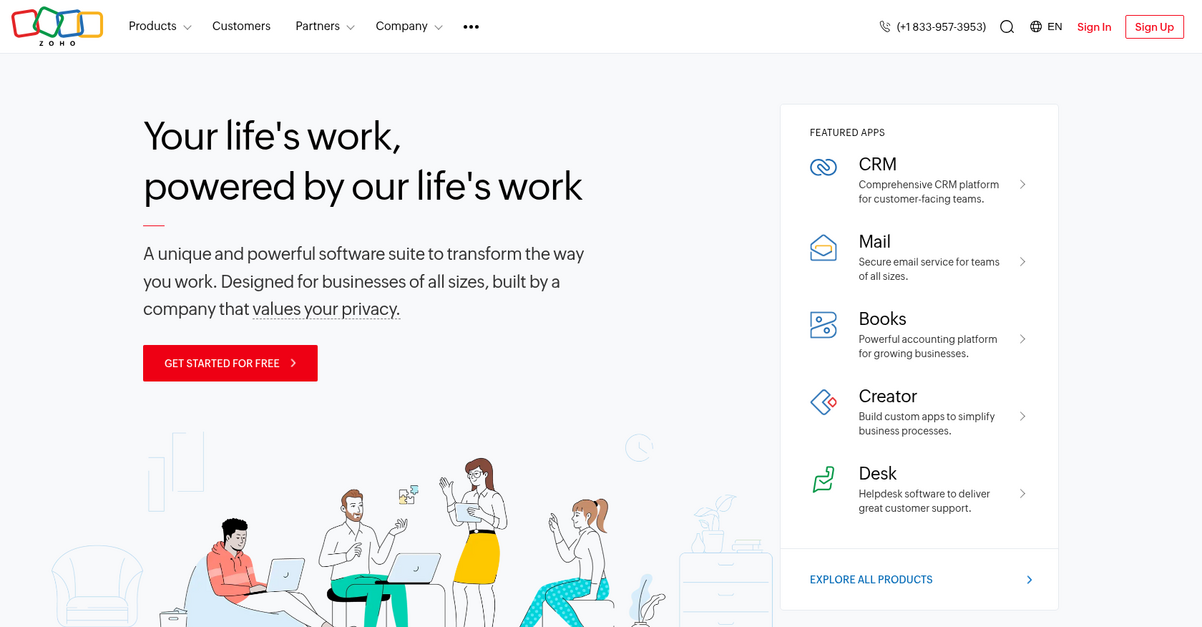
Struggling to consolidate data and generate actionable reports?
Zoho offers a unified cloud software suite, transforming how your business operates by breaking down departmental departmental silos. This platform provides comprehensive solutions, helping you unite all your data into one system. You can streamline complex business processes, saving valuable time and improving accuracy. It’s the operating system for your business.
How can you turn data into decisions?
Zoho helps your business track sales and investments, offering autonomous control and customization. You can easily automate processes, improving efficiency tenfold and allowing you to scale without manual data entry. This robust operating system contains the collective memory of your entire business. It simplifies HR, customer support, and accounting, ensuring productivity increases by up to 80%. Business growth is easy to track because Zoho helps you sync data.
You can truly do your best work.
While we’re discussing turning data into decisions, understanding user behavior insights is equally important.
Key features:
- Unified cloud software: Run your entire business from one integrated platform, breaking down silos and increasing organizational efficiency by consolidating all data.
- Customizable processes: Automate your business processes and customize the platform to fit your unique needs, helping you track growth and improve efficiency.
- Comprehensive solutions: Access a wide range of powerful apps like CRM, Mail, Books, People, and Desk, designed to manage sales, marketing, and invoicing.
Learn more about Zoho features, pricing, & alternatives →
Verdict:
Zoho stands out as one of the best reporting tools because it unifies data across your entire business, increasing productivity by up to 80%. Its customizable features and automated processes help you streamline operations, making it suitable for businesses of all sizes looking to turn raw data into informed decisions.
3. Whatagraph
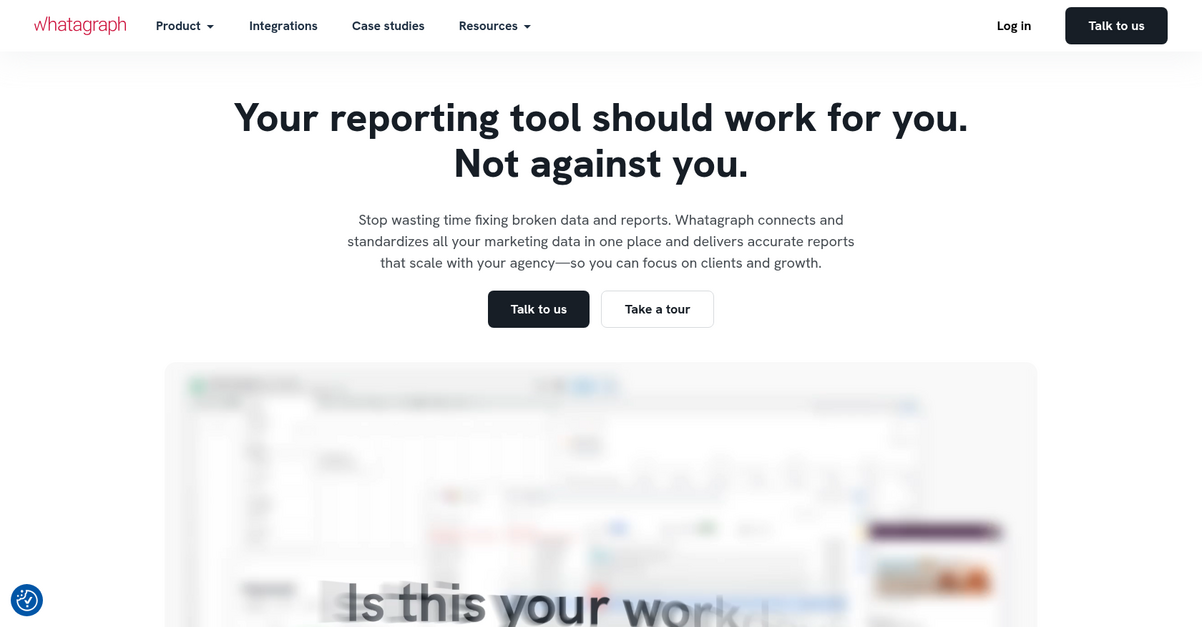
Tired of broken data and reports?
Whatagraph connects and standardizes your marketing data in one place, ensuring accurate reports that scale.
This tool helps your agency focus on clients and growth by providing a single source of truth for marketing data. Your reporting tool should work for you, not against you.
Stop wasting time fixing data.
Whatagraph gathers data directly from over 55 platforms, allowing you to connect and build custom APIs without needing to write any code. This means your data flows straight from the source, so you never worry about broken connections or inaccurate information. You can even upload your own data via Google Sheets or CSVs and expect a consistent 30-minute data refresh rate across all sources.
It provides live, interactive, white-labeled reports in minutes, regardless of the number of sources or metrics. Whatagraph also summarizes insights through AI, presenting your KPIs and trends in one place for instant, actionable insights.
Actionable insights from your data, fast.
Key features:
- Connect Accurate Data: Integrate with 55+ platforms and build custom APIs code-free, ensuring data flows directly from the source for consistent accuracy.
- Organize and Report Efficiently: Blend, unify, and standardize your data without coding, then create automated, white-labeled reports in minutes for stunning visualizations.
- Act on AI-Powered Insights: Monitor KPIs and trends in one place, with AI-summarized insights that help your account managers make smart, fast decisions.
Learn more about Whatagraph features, pricing, & alternatives →
Verdict:
Whatagraph transforms raw marketing data into compelling reports, addressing the pain points of fragmented data and manual reporting. With features like direct platform connections, white-label reports, and AI-powered insights, it saves agencies significant time—like Market Solutions saving 70% on reporting—making it one of the best reporting tools for data-driven decisions.
4. Tableau

Struggling to turn raw data into actionable insights?
Tableau’s visual analytics platform helps you ask questions and explore data without learning complex software. This empowers you to overcome inconsistencies and integrate disparate systems.
Their intuitive products, with built-in visual best practices, let you dive deep into data exploration without interrupting your analysis flow. This means quicker, more reliable reports.
It’s about making data-driven decisions.
Tableau unlocks your data’s full potential with agentic analytics, delivering trusted insights across your organization. It helps you manage data and leverage integrated AI/ML capabilities, saving valuable time.
You can deploy Tableau in the cloud, on-premises, or natively integrate with Salesforce CRM, connecting to all your data sources effortlessly. This ensures seamless data integration, a common pain point.
For analysts, business leaders, and IT leaders, Tableau offers AI-powered insights, governance for trusted data, and accelerated efficiency, enabling you to build and embed analytics for your teams and clients. JLR even delivered £250M in business value.
Transform your raw data into compelling visual narratives.
Key features:
- Visual Analytics Platform: See, understand, and act on data with an intuitive platform transforming how you solve problems and achieve a data-driven organization.
- Agentic Analytics & AI Assistant: Fuel faster insights and actions, leveraging AI-powered conversational assistance to breeze through data preparation and create visualizations faster.
- Broadest Analytics Platform: Deploy in the cloud or on-premises, connecting to all your data with integrated AI/ML capabilities, governance, and visual storytelling features.
Learn more about Tableau features, pricing, & alternatives →
Verdict:
Tableau provides an intuitive, AI-powered visual analytics platform that addresses the pain points of consolidating data, creating insightful visualizations, and generating actionable reports. Its agentic analytics and seamless data integration make it one of the best reporting tools for transforming raw data into compelling visual narratives, as demonstrated by customers like JLR, who delivered £250M in business value.
5. HubSpot
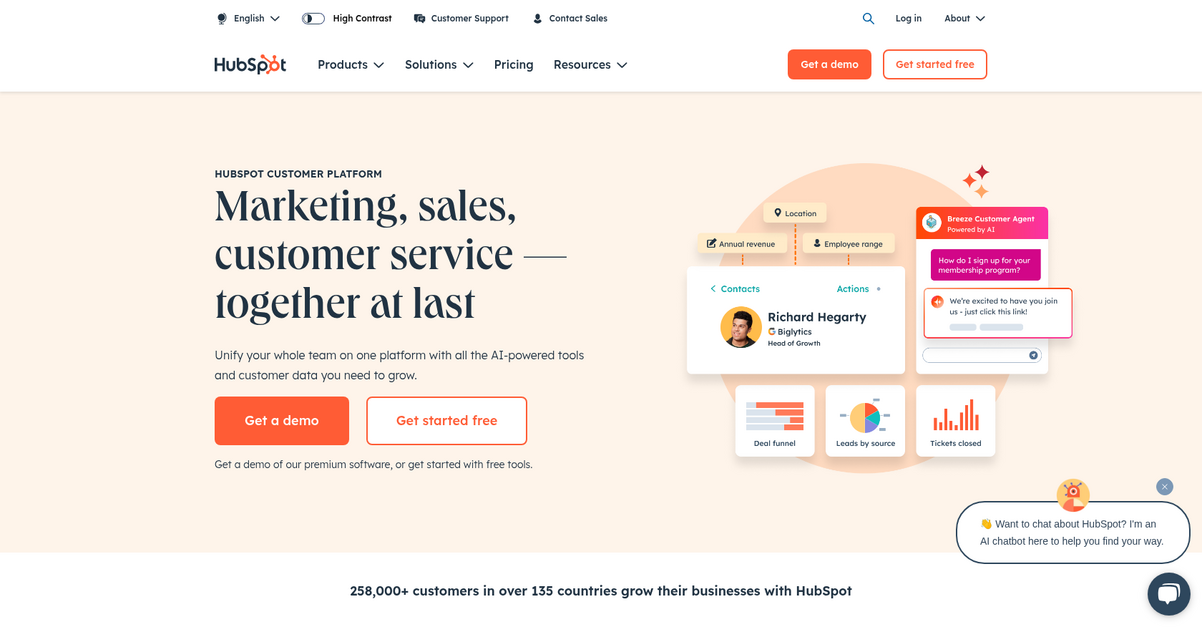
Are your reporting efforts consolidating data effectively?
HubSpot’s AI-powered customer platform helps you unify marketing, sales, and service data on one system.
This integrated approach means your teams get a single, unified view of the customer, enabling smarter decisions without manual data compilation.
It’s time to transform your data.
HubSpot solves the challenge of disparate data sources, offering a comprehensive platform that brings all your customer information together.
With its Smart CRM, you get AI-powered reporting and contact management, which means you can create personalized customer experiences at scale by unifying data and tech stacks.
Beyond the core CRM, HubSpot offers specialized hubs like Marketing, Sales, Service, and Operations, all powered by AI to automate tasks, generate leads, build pipelines, scale support, and activate your data efficiently.
Experience unified data for growth.
Key features:
- AI-powered Customer Platform: Unifies marketing, sales, and service data on one easy-to-use platform, delivering faster ROI and improving customer happiness.
- Smart CRM with AI Reporting: Provides a centralized system for customer data, offering AI-powered reporting and contact management for personalized experiences.
- Breeze AI Agents: Extends your team’s capabilities by automating tasks like scaling customer support, sales prospecting, and content creation in minutes.
Learn more about HubSpot features, pricing, & alternatives →
Verdict:
HubSpot stands out as one of the best reporting tools because it unifies your entire front office on an AI-powered platform. This integration enables teams to gain a single view of the customer, streamlining operations and significantly improving lead acquisition and deal closure, with customers acquiring 129% more leads and closing 36% more deals after one year.
6. Power BI
Struggling with fragmented data and slow reporting?
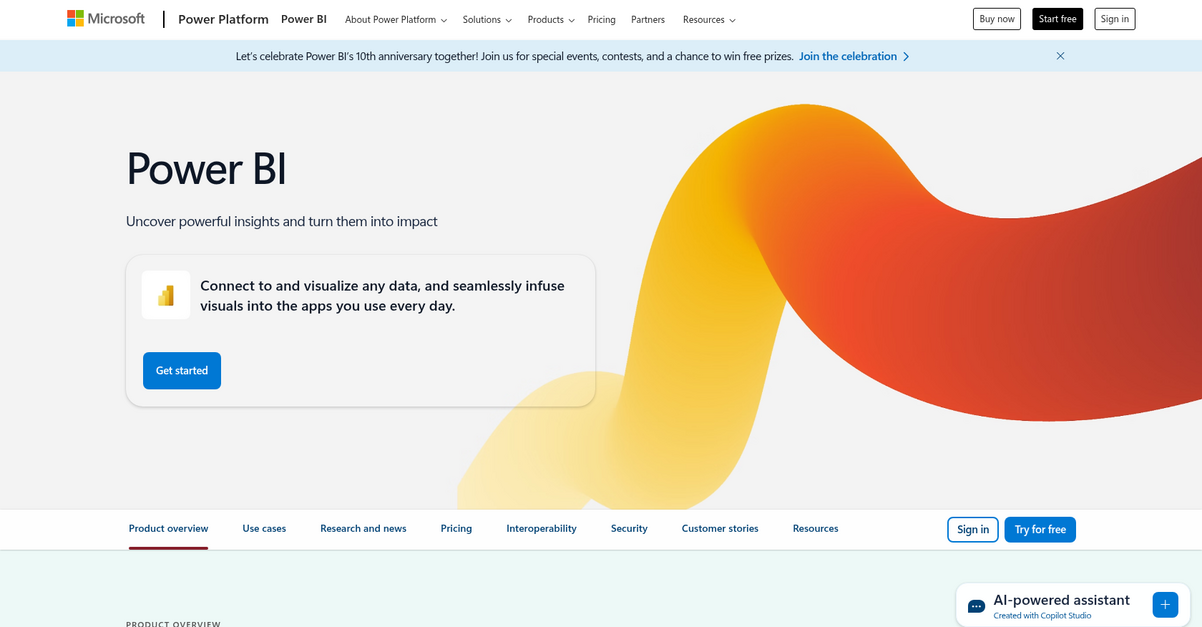
Power BI helps you transform your disparate data into actionable visuals using AI capabilities and intuitive report creation tools.
Your business needs to uncover powerful insights and turn them into impact, and Power BI empowers you to achieve this by centralizing your data.
It’s time to infuse insights everywhere.
Power BI allows you to unify all your data sources into OneLake, establishing a single source of truth for your entire organization. You can then leverage easy-to-use AI features to find patterns, create reports instantly, and get answers in conversational language. Seamlessly embed these insights into daily apps like Microsoft Teams, PowerPoint, and Excel, helping users make better decisions. Furthermore, Power BI scales across thousands of users, managing petabytes of data while ensuring robust security and governance.
Transform raw data into compelling visual narratives.
While we’re discussing data capabilities, you might also be interested in my guide on best test maker software for creating robust assessments.
Key features:
- AI-powered insights: Utilize advanced AI capabilities to quickly analyze data, auto-generate reports, and derive key answers through conversational queries.
- Unified data hub: Consolidate data from any source into OneLake, establishing a single, governed source of truth to ensure consistency and reduce duplication.
- Seamless integration: Infuse data visualizations and interactive reports directly into Microsoft 365 apps like Teams, Excel, and PowerPoint for widespread access.
Learn more about Power BI features, pricing, & alternatives →
Verdict:
Power BI empowers you to transform raw data into compelling visual narratives, driving informed decision-making and business growth. Its AI capabilities, unified data hub, and seamless integration with Microsoft 365 make it one of the best reporting tools, evidenced by a Forrester Consulting study showing a 321% ROI over three years for Power BI and Microsoft 365 users.
7. Teamwork

Are you struggling with scattered data and delayed decisions?
Teamwork helps you unify projects, tickets, and time tracking to bring all your crucial information into one central place. This means you can consolidate data effortlessly, eliminating manual compilation time.
Your current reporting solutions might leave you frustrated with inconsistent results, but Teamwork provides real-time performance reports and unified dashboards. This ensures clarity and accuracy, boosting confidence in your data-driven strategies.
Discover a more efficient way to report.
Teamwork tackles the core problem of fragmented data by offering real-time visibility into all your client projects and team performance. You can easily track costs, manage budgets, and maximize billable time, ensuring your projects remain profitable.
Its robust resource management features let you see staff availability and workloads at a glance, forecasting resources without guesswork. This helps you optimize team utilization and deliver projects faster.
Furthermore, Teamwork integrates with over 150 apps, including accounting, CRM, and productivity tools, allowing you to centralize reporting. It also includes AI-powered features to automate tasks and provide smart insights, reducing busywork and freeing up brainpower for analysis.
Turn raw data into actionable insights.
While focusing on software to boost productivity, you might also find my guide on best interior design tools insightful for creative projects.
Key features:
- Real-time reporting: Get instant performance insights and unified dashboards for comprehensive project and resource visibility, supporting faster, informed decisions.
- Integrated profitability tools: Track costs, manage budgets, and monitor billable hours to ensure every project remains profitable and maximizes your return on investment.
- AI-powered automation: Leverage AI to streamline tasks, speed up planning, and gain smart insights, reducing manual effort and improving data accuracy.
Learn more about Teamwork features, pricing, & alternatives →
Verdict:
Teamwork is an ideal choice for businesses seeking the best reporting tools. Its ability to consolidate project, resource, and financial data into real-time reports, coupled with AI-driven insights, helps you achieve 360° visibility and 100% transparency in billing, slashing report generation time.
8. Looker Studio
Struggling to make data-driven decisions from scattered information?
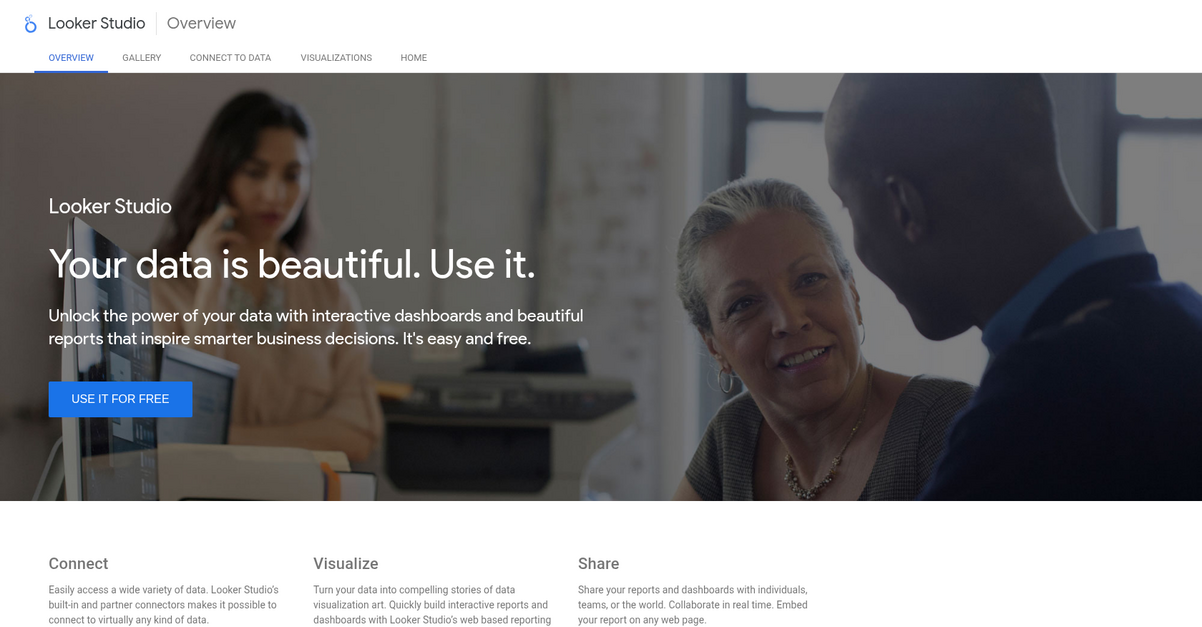
Looker Studio’s built-in and partner connectors effortlessly unify diverse data sources, addressing your core challenge of fragmented insights.
This capability eliminates manual data compilation, helping you focus on analysis instead of aggregation efforts.
Unlock the full potential of your data.
Looker Studio empowers you to transform raw numbers into compelling visual stories, quickly building interactive reports and dashboards from your web browser.
You can turn your data into captivating visualization art, allowing for seamless communication of complex insights. This platform provides web-based reporting tools to visualize your information effectively and share it effortlessly with individuals, teams, or even embed it on any webpage. Plus, you can collaborate in real-time, ensuring everyone is always aligned.
With Looker Studio, you can inspire smarter business decisions.
If you’re also looking into tools for critical decision-making, my article on best clinical decision support system covers specialized solutions.
Key features:
- Diverse data connectivity: Connect to virtually any kind of data using built-in and partner connectors, overcoming the pain point of fragmented data sources.
- Interactive visualizations: Quickly build interactive reports and dashboards using web-based tools, turning raw data into compelling visual narratives.
- Real-time collaboration and sharing: Share reports with individuals or teams and embed them on any webpage, fostering collaborative, data-driven decision-making.
Learn more about Looker Studio features, pricing, & alternatives →
Verdict:
Looker Studio empowers you to overcome data fragmentation and visualization challenges by providing seamless connectivity, intuitive interactive dashboards, and real-time sharing. It’s an easy and free solution that helps you turn data into compelling stories, making it one of the best reporting tools for data-driven strategic planning and measurable business growth.
9. Sisense
Struggling to turn raw data into actionable decisions?
Sisense offers an AI-powered analytics platform that simplifies data modeling and visualization.
You can effortlessly create intelligent data experiences without complexity, making insights accessible to every user. This bridges the gap between insights and action.
Unlock smarter, faster decisions.
Sisense Intelligence helps app creators and developers deliver smarter, embedded analytics with AI-driven features. You can build smarter and in less time, simplifying every step with intuitive tools.
Whether you are designing new dashboards or embedding analytics into your product, Sisense features like assistant and narrative enable natural-language exploration. This means auto-generated summaries, so you gain insights faster and more often, without requiring data science expertise. Furthermore, you can accelerate innovation with predictive analytics like forecast and trend to uncover patterns and surface anomalies.
Key features:
- AI-powered analytics: This capability makes modeling, visualizing, customizing, and integrating analytics effortless, guiding your users to better, faster decisions right where they work.
- Embeddable components: Sisense makes it easy for your developers to integrate AI-powered analytics into any app, delivering a seamless experience without clunky workarounds.
- Predictive analytics: Move beyond traditional business intelligence by accessing real-time insights and anticipating what’s next with features like forecast and trend.
Learn more about Sisense features, pricing, & alternatives →
Verdict: Sisense stands out as one of the best reporting tools, especially if you need to transform complex data into clear, actionable insights quickly. Its AI-powered platform and embedded analytics capabilities empower you to streamline data interpretation and accelerate decision-making, as evidenced by positive user reviews.
10. Atlassian
Struggling with scattered data and delayed decision-making?
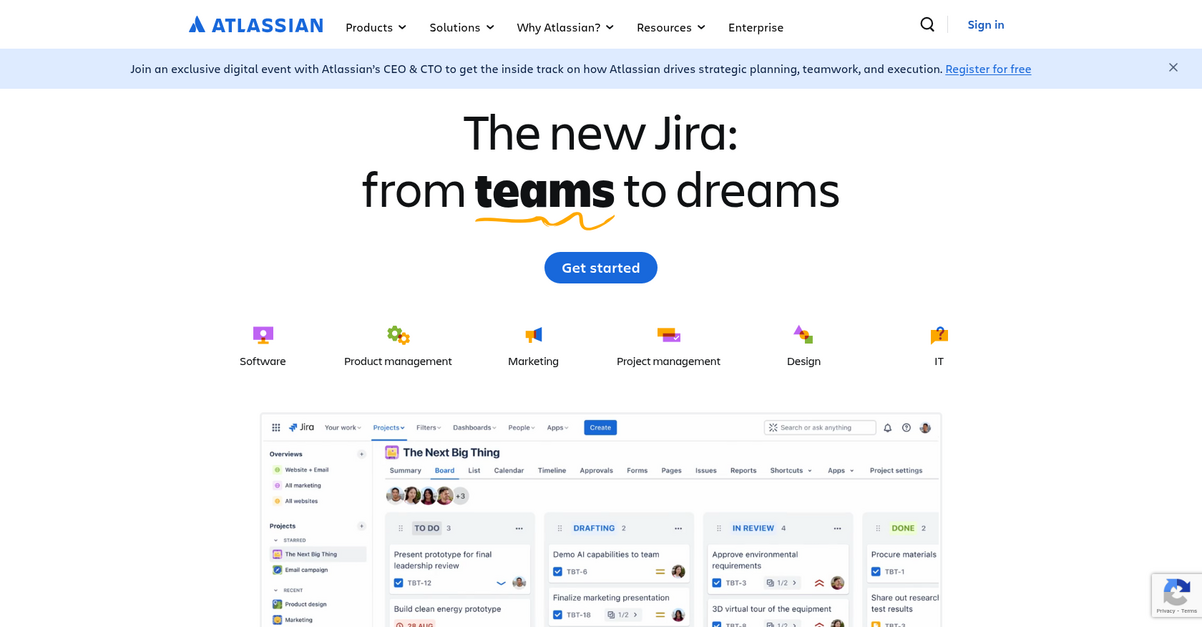
Atlassian offers a connected platform with tools like Jira and Confluence for flexible project management and centralized knowledge.
You can consolidate information and streamline workflows, which means you’ll spend less time manually compiling data. This allows you to effectively communicate data insights.
Unleash the power of teamwork!
Atlassian’s integrated platform provides a powerful system of work, turning raw data into strategic insights.
With Jira for flexible project management and Confluence for knowledge sharing, you gain a unified view, crucial for actionable reporting. These tools support agile workflows and allow you to capture, prioritize, and plan ideas, optimizing your strategy.
The platform also offers AI-powered agents and integrations for thousands of apps, transforming teamwork and elevating your reporting capabilities to drive measurable growth.
Unlock your data’s true potential.
Before diving deeper, you might find my analysis of best document collaboration software helpful for enhancing team workflows.
Key features:
- Flexible Project Management (Jira): Helps you plan, track, and deliver ideas, providing structured data for your reporting needs.
- Centralized Knowledge (Confluence): Consolidates scattered documents and information into a single source of truth, improving data consistency for reports.
- Enterprise-scale Strategic Planning (Focus): Provides tools for high-level planning and value tracking, making it easier to report on strategic outcomes.
Learn more about Atlassian features, pricing, & alternatives →
Verdict: Atlassian’s suite of products, including Jira and Confluence, provides flexible project management and centralized knowledge, making it an excellent choice for best reporting tools. Your team can leverage integrated workflows and strategic planning tools to consolidate data, create insightful visualizations, and drive informed decisions, as demonstrated by Royal Caribbean saving over 800 hours annually.
Conclusion
Don’t let bad data stall decisions.
Manually pulling data from dozens of sources isn’t just slow. It creates inconsistent reports that no one on your team can fully trust.
Automated tools make a huge difference. Organizations using them reduce report generation time by 60% and slash manual data errors by half. This gives you faster, more reliable insights.
So, what’s the best choice?
After reviewing them all, I recommend Domo. Its ability to connect and prepare data from any source tackles the core problem of data chaos.
What truly sets it apart are its AI-assisted tools that help you explore data and automate tasks. The best reporting tools should empower you, and Domo does just that.
Speaking of secure data, if your growth involves strategic transactions, my article on best virtual data room software can help.
I suggest you see it in action. Start a free trial of Domo to experience how it can transform your workflow.
Finally get ahead of your data.


