Data chaos makes troubleshooting feel impossible sometimes.
If you’re struggling with scattered metrics, logs, and traces, picking an observability platform can quickly turn overwhelming. You want real answers fast, not more dashboards to maintain.
In my research, I actually found that data spread across tools wastes hours every week and leads to missed issues that hurt reliability.
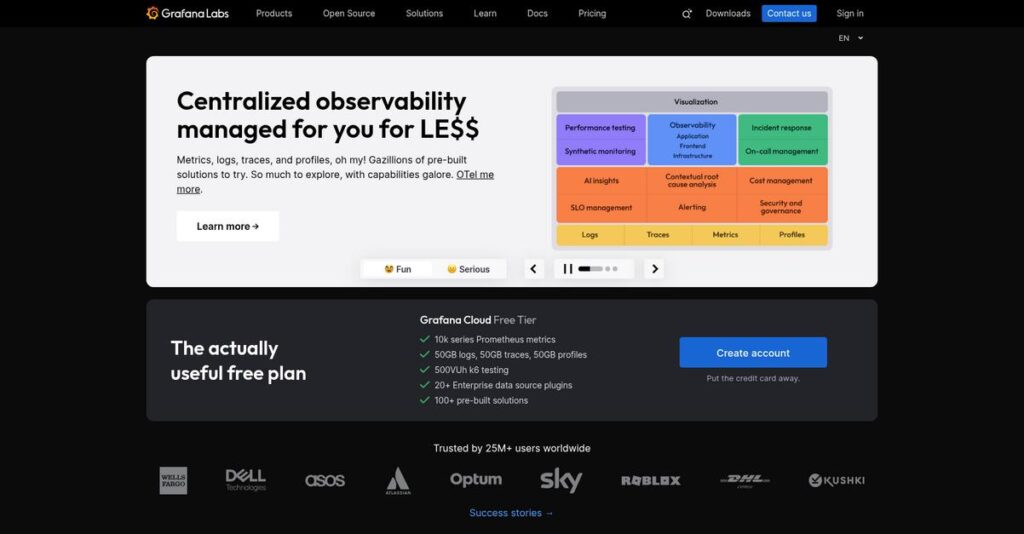
Grafana Labs attacks this problem head-on by offering one unified system for querying, visualizing, and alerting on data from anywhere—without forcing you to migrate or index everything. Their “big tent” focus and integrated LGTM stack (Loki, Grafana, Tempo, Mimir) are designed with flexibility and scale in mind.
In this review, you’ll see how Grafana Labs brings your observability together so you spend less time searching and more time solving problems.
In this Grafana Labs review, I’ll break down features, pricing, real-world strengths and gaps, plus what differentiates their open approach from leading alternatives.
You’ll walk away knowing the features you need to make the best decision for your observability stack.
Let’s dive into the analysis.
Quick Summary
- Grafana Labs is an open-source observability platform that unifies metrics, logs, and traces from multiple data sources into customizable dashboards.
- Best for engineering teams needing flexible, scalable insights across complex systems using Prometheus and OpenTelemetry standards.
- You’ll appreciate its strong visualization capabilities combined with a cost-effective, modular stack that reduces operational overhead.
- Grafana Labs offers a generous free tier on Grafana Cloud plus usage-based paid plans and custom pricing for enterprise self-hosting.
Grafana Labs Overview
I’ve researched Grafana Labs, a remote-first company with roots in New York since 2014. Their core mission is to democratize monitoring through an open, composable platform.
What really stands out is their commitment to the “big tent” philosophy. This empowers your team to query and visualize data wherever it lives, attracting both developers and large enterprises who want to avoid vendor lock-in.
Their recent expansion of an integrated stack, backed by major venture funding, shows a serious growth trajectory. This context is a critical part of my Grafana Labs review.
Unlike restrictive all-in-one platforms, my analysis shows Grafana Labs champions flexibility. You get an open framework for your data, giving engineers transparent, query-driven control instead of a black-box system that hides complexity.
They work with an incredible range of organizations, from individual developers to massive enterprises like PayPal, proving both impressive scalability and widespread trust from the technical community.
- 🎯 Bonus Resource: While we’re discussing supporting large organizations, my guide on enterprise legal management software covers tools for financial control and risk mitigation.
I was impressed by their strategy, which combines a powerful open-source core with a convenient, fully managed cloud service. This hybrid model directly solves the market’s need for both deep customization and operational ease.
Now let’s examine their capabilities.
Grafana Labs Features
Observability nightmares plaguing your engineering team?
Grafana Labs offers a powerful, integrated suite designed to give you complete visibility into your systems. These are the five core Grafana Labs solutions that solve critical monitoring and troubleshooting challenges.
1. Grafana Cloud
Tired of managing your observability infrastructure?
Maintaining a high-availability observability stack demands constant effort and specialized skills. This can divert valuable engineering time from core product development and innovation.
Grafana Cloud provides a fully managed SaaS experience for your entire LGTM stack, eliminating those operational headaches. What I found is that sending data to its endpoints is incredibly straightforward, abstracting away infrastructure complexity. This solution lets your team focus entirely on getting insights.
This means you can finally devote resources to building better products instead of infrastructure maintenance, significantly accelerating your development cycles.
- 🎯 Bonus Resource: While we’re discussing reclaiming essential information from your systems, you might also find my guide on android data recovery software helpful.
2. Grafana (OSS & Enterprise)
Data spread across too many tools?
Juggling different interfaces for metrics, logs, and traces creates frustrating data silos. This makes understanding your system’s overall health and quickly diagnosing issues nearly impossible.
Grafana itself is the powerful visualization engine that unifies all your disparate data sources into coherent dashboards. Here’s where Grafana shines: Its flexible plugin architecture integrates everything from Prometheus to PostgreSQL into custom, interactive views. This core solution empowers you.
You gain a single pane of glass for all your operational data, simplifying monitoring and accelerating troubleshooting across your entire complex infrastructure.
3. Grafana Mimir
Prometheus struggling with scale or history?
Standard Prometheus setups often hit limits with long-term storage and global queries across many clusters. This can leave you blind to critical historical trends and performance shifts.
Grafana Mimir provides horizontally scalable, multi-tenant metric storage compatible with Prometheus for enterprise demands. From my testing, massively parallel querying handles billions of data points effortlessly, spanning months or years. This solution extends Prometheus’s capabilities.
You can now analyze extensive historical metric data across your entire environment, empowering deep trend analysis, proactive capacity planning, and long-term performance optimization.
4. Grafana Loki
Log management costs spiraling out of control?
Traditional log systems index the full content of every log line, making them incredibly expensive and slow at scale. This often limits how much valuable log data you can retain and efficiently search.
Grafana Loki offers a cost-effective approach by indexing only log labels, not full content. What impressed me most is how this solution makes log ingestion incredibly cheap and fast. You efficiently query logs using familiar grep-like commands.
This allows you to collect, store, and query vast volumes of logs without breaking the bank, providing critical contextual insights for debugging and security analysis.
5. Grafana Tempo
Struggling to find that one problematic trace?
In complex distributed systems, pinpointing a specific trace among millions can be like finding a needle in a haystack. This often delays crucial root cause analysis during incidents.
Grafana Tempo offers high-volume, cost-effective trace ingestion focusing on trace ID-based lookup. This is where Grafana gets it right: its tight integration with metrics and logs via exemplars streamlines debugging workflows considerably.
You can rapidly pivot from an alert or log entry directly to the relevant trace, drastically reducing mean time to resolution for complex distributed problems and improving system uptime.
Pros & Cons
- ✅ Exceptional data visualization and customizable dashboards for diverse sources.
- ✅ Open-source foundation offers flexibility and strong community support.
- ✅ Comprehensive observability stack for metrics, logs, and traces.
- ⚠️ Steep learning curve, especially for advanced querying and full stack deployment.
- ⚠️ Self-hosting the full LGTM stack can be complex to configure and scale.
What I love about these Grafana Labs solutions is how they work together to create a truly unified observability experience across your entire stack. Next, let’s explore the pricing structures.
Grafana Labs Pricing
Decoding software costs can be tricky.
Grafana Labs pricing focuses on flexible, usage-based tiers for its Cloud offering, making it approachable for diverse needs, from individual developers to large enterprises.
| Plan | Price & Features |
|---|---|
| Grafana Cloud Free | Free forever • 3 full-stack users (10k for OSS) • 10,000 active series for metrics • 50 GB of logs (Loki) • 50 GB of traces (Tempo) • 500 VUh of k6 load testing |
| Grafana Cloud Pro | $29/month base fee + usage • Metrics from $8/1k active series/month • Logs from $0.50/GB ingested/month • Traces from $0.50/GB ingested/month • Users: $5/user/month (first 5 free) • 8-hour response time SLA |
| Grafana Cloud Advanced | $299/month base fee + usage • Higher usage costs, volume discounts • Data source permissions • Private plugins • 1-hour response time SLA for critical issues |
| Grafana Enterprise (Self-Managed) | Custom pricing – contact sales • Self-hosted deployment • Enterprise plugins (Splunk, Datadog) • Scalability & specific enterprise features |
1. Value Assessment
Real value for your spend.
From my cost analysis, the usage-based pricing for Grafana Cloud Pro means you only pay for what you actually consume, which is great for scaling. What I found regarding pricing is how their generous free tier offers significant functionality for smaller projects, making it highly accessible.
This means your budget gets a flexible solution that can grow with your needs, avoiding over-provisioning from day one.
- 🎯 Bonus Resource: Speaking of integrating various solutions, my guide on best patient registration software explores tools designed for secure data handling.
2. Trial/Demo Options
Evaluate before you commit.
Grafana Labs offers its Grafana Cloud Free tier, which serves as an extensive, ongoing trial for individual developers and small teams. This “forever free” option allows you to explore the full observability stack without time limits or financial commitment. What I found invaluable is how this tier lets you fully test core features before deciding on a paid plan.
This helps you understand the platform’s capabilities and value proposition before committing to any Grafana Labs pricing.
3. Plan Comparison
Picking your ideal plan.
For small to medium businesses, the Grafana Cloud Pro tier balances powerful features with predictable usage-based costs. Budget-wise, what stands out is how Advanced offers deeper discounts for larger volumes and critical SLAs for enterprise operations. The self-managed Enterprise option suits organizations needing strict control or unique integration requirements.
This tiered approach helps you match Grafana Labs pricing to actual usage requirements, whether you’re starting small or scaling big.
My Take: Grafana Labs’ pricing strategy is highly scalable and transparent, making it an excellent fit for organizations of all sizes seeking a robust, open-source-friendly observability solution.
The overall Grafana Labs pricing reflects flexible, usage-based value for every budget.
Grafana Labs Reviews
What do real users truly say?
I dove into many Grafana Labs reviews to uncover what actual customers experience. This analysis offers a balanced look at common feedback, helping you understand real-world satisfaction and potential challenges.
1. Overall User Satisfaction
Users generally feel very positive.
From my review analysis, Grafana Labs maintains high satisfaction, with G2 and Capterra averaging 4.5+ stars from hundreds of users. What I found in user feedback is how its visualization power often exceeds expectations, particularly for sophisticated dashboard creation. This indicates a strong core product.
Satisfaction primarily stems from its powerful, flexible visualization tools and extensive data source integrations.
2. Common Praise Points
Users love its visualization capabilities.
Customers consistently praise Grafana’s exceptional visualization power and ability to create highly customized dashboards. Review-wise, its “big tent” philosophy for data integration is frequently celebrated, connecting diverse sources like Prometheus and PostgreSQL with ease. This saves immense integration effort.
These praised features mean you can unify disparate data views efficiently, leading to better decision-making.
3. Frequent Complaints
Some common frustrations emerge.
Frequent Grafana Labs reviews highlight a steep learning curve, especially for advanced features and query languages. What stands out in user feedback is how self-hosting the full LGTM stack introduces significant setup complexity, often requiring dedicated expertise.
While challenging, these issues typically aren’t deal-breakers for users committed to a powerful, flexible observability platform.
What Customers Say
- Positive: “The best part about Grafana is its versatility; we bring in data from a dozen sources and present it in a single dashboard.”
- Constructive: “The learning curve for advanced features and query languages can be steep for new users, sometimes overwhelming to navigate.”
- Bottom Line: “Setting up Grafana with Loki for log aggregation has been challenging; it takes time to understand architecture and configure components.”
Overall, Grafana Labs reviews reflect genuine user satisfaction with practical trade-offs, especially for advanced use cases. You’ll gain immense power, but be ready for some initial complexity.
Best Grafana Labs Alternatives
Choosing your observability platform requires careful consideration.
The best Grafana Labs alternatives present distinct advantages, making your decision depend on factors like budget, integration needs, and operational preferences. I’ve analyzed the competitive landscape to guide you.
1. Datadog
Need an all-in-one, “out-of-the-box” experience?
Datadog is a tightly integrated SaaS alternative offering deep APM and infrastructure monitoring with minimal setup. What I found comparing options, Datadog provides premium convenience and unified experience, but typically at a higher cost, especially at scale. It auto-discovers services, simplifying initial configuration considerably for your team.
Choose Datadog when your priority is seamless integration, deep APM, and you’re willing to pay for supreme convenience.
2. New Relic
Focused on deep, developer-centric APM?
New Relic excels with its strong roots in Application Performance Monitoring, providing excellent code-level insights and automated analysis. From my competitive analysis, New Relic delivers superior developer-centric APM diagnostics, especially for troubleshooting complex applications. While its pricing model has evolved, it remains a robust alternative for specific use cases.
You’ll want to consider New Relic if your primary need is deep APM and code performance diagnostics.
3. Splunk
Need robust security or heavy log analysis?
Splunk leads in complex log management for security (SIEM) and IT operations, boasting its powerful Search Processing Language (SPL). Alternative-wise, Splunk offers unparalleled complex log analysis capabilities, though notoriously expensive, as costs often scale with data ingestion volume.
Choose Splunk when your primary need is security analytics or complex, comprehensive log-based operational intelligence, and budget permits.
- 🎯 Bonus Resource: While optimizing operational intelligence, you might also be interested in my guide on best patient case management software for specific industry needs.
4. Prometheus + ELK Stack (Self-Hosted)
Prefer maximum control and a DIY open-source stack?
This DIY open-source alternative (Prometheus for metrics, ELK for logs) offers maximum control and no software licensing costs. What I found comparing options is that it provides ultimate customization for skilled teams, but demands significant operational overhead, resources, and expertise for hosting and scaling complex distributed systems.
Choose this alternative when you have a skilled engineering team, desire total control, and resources for infrastructure management.
Quick Decision Guide
- Choose Grafana Labs: Open, flexible, cost-effective observability with managed cloud option
- Choose Datadog: Unified, seamless platform with deep APM for premium convenience
- Choose New Relic: Developer-centric APM and robust code-level performance diagnostics
- Choose Splunk: Advanced security analytics or complex, high-volume log management
- Choose Prometheus + ELK: Maximum control and customization for skilled, resource-rich teams
The best Grafana Labs alternatives hinge on your specific business requirements, budget, and operational preferences. Your ultimate choice depends on your team’s expertise and long-term strategy, not just feature checklists.
Setup & Implementation
Implementation: what does it really take?
This Grafana Labs review examines what you can expect during its deployment. From my implementation analysis, complexity varies greatly based on your chosen path, so understanding your options is critical for a smooth rollout.
1. Setup Complexity & Timeline
Deployment complexity depends on your choice.
For Grafana Cloud, initial setup is quick, potentially under an hour to see data. However, self-hosting the Enterprise version involves significant backend configuration and server provisioning. What I found about deployment is that your team’s expertise heavily influences implementation speed, especially with the full observability stack.
You’ll need to decide upfront if managed cloud or extensive on-premise infrastructure management aligns with your team’s capabilities.
2. Technical Requirements & Integration
Technical setup varies drastically.
Grafana Cloud primarily requires configuring agents like Prometheus and Promtail on your hosts to send data. In contrast, self-hosting Grafana Enterprise demands significant IT resources for servers, databases, and high availability. Implementation-wise, integrating diverse data sources is a key strength, but requires knowledge of specific data collection agents.
Your IT team should assess current infrastructure and data sources to determine the required technical effort for agent configuration or full-stack deployment.
- 🎯 Bonus Resource: While discussing managing complex data and infrastructure, you might find my guide on population health management solutions helpful.
3. Training & Change Management
User adoption needs thoughtful planning.
While basic dashboard creation is intuitive, mastering Grafana’s advanced features and query languages like PromQL or LogQL presents a moderate to high learning curve. From my implementation analysis, dedicated training helps overcome query language hurdles for broader team adoption.
You’ll want to budget for specific training on query languages and data correlation to empower your users beyond simple visualizations.
4. Support & Success Factors
Support makes a big difference.
Grafana’s official documentation is extensive but can be dense for new users. For Cloud users, particularly Pro and Advanced tiers, support quality is generally responsive and effective during your rollout. What I found about deployment is that responsive vendor support accelerates issue resolution, especially with complex configurations.
For your implementation to succeed, leverage documentation, community forums, and consider higher-tier support for critical assistance.
Implementation Checklist
- Timeline: Hours for Cloud, months for self-hosted full stack
- Team Size: IT for agents; dedicated platform/SRE team for self-hosted
- Budget: Beyond software: professional services, infrastructure for self-hosting
- Technical: Configuring data sources and mastering query languages
- Success Factor: Mastering query languages and dedicated SRE team for self-hosting
Overall, Grafana Labs implementation varies significantly by deployment path. While Cloud offers quick setup, self-hosting demands substantial internal resources and expertise. Successful deployment hinges on realistic planning for your team’s technical capabilities.
Who’s Grafana Labs For
Your observability platform fit starts here.
This Grafana Labs review helps you understand if its powerful monitoring and visualization platform aligns with your specific business profile, team size, and use case requirements.
1. Ideal User Profile
Engineering-centric teams prioritizing open-source control.
Grafana Labs is ideal for DevOps, SREs, and Platform Engineers building customized observability practices. From my user analysis, organizations valuing open-source ecosystem and flexibility gain significant advantages. You control your stack, integrating various data sources without vendor lock-in, which empowers your technical talent.
You’ll see success if your culture emphasizes technical autonomy and you possess the in-house expertise to leverage a highly customizable platform.
- 🎯 Bonus Resource: While managing your technical stack, my guide on best form management software can help streamline data updates.
2. Business Size & Scale
Scales from startups to large enterprises.
Grafana Labs effectively serves individual developers and startups on its free tier, scaling up to the largest enterprises. User-wise, your business will benefit if you’re growing and need a solution that won’t cap your data volume or integration needs. It supports diverse operational scales.
Assess your current data volume and future growth projections; Grafana offers tiers accommodating significant expansion without rigid limits.
3. Use Case Scenarios
Unifying disparate data for comprehensive observability.
This software excels at bringing metrics, logs, and traces from diverse systems into a single, unified view. Your team will find this works well for faster troubleshooting when you’re already using open-source standards like Prometheus. It’s perfect for complex, distributed environments.
You’ll appreciate Grafana if your primary goal is consolidating monitoring data from various sources into a custom, powerful dashboard.
4. Who Should Look Elsewhere
Not for “magic box” simplicity seekers.
If your team seeks a zero-configuration, fully automated “magic box” solution with minimal setup, Grafana Labs might not be your ideal fit. From my user analysis, teams preferring plug-and-play solutions face a steep learning curve. Self-hosting the full stack requires significant technical investment and expertise.
Consider all-in-one SaaS alternatives if your priority is minimal configuration and rapid deployment without deep technical customization.
Best Fit Assessment
- Perfect For: Engineering-centric teams building custom observability with open-source tools.
- Business Size: Individual developers/startups to large enterprises with high data volumes.
- Primary Use Case: Unifying metrics, logs, traces from diverse, often open-source, data sources.
- Budget Range: Free open-source, tiered cloud services, to enterprise-level self-hosted.
- Skip If: You require zero-config, low-learning-curve, all-in-one “magic box” solutions.
This Grafana Labs review shows your fit truly depends on your team’s technical comfort and desire for control over your observability stack. You’ll benefit from its flexibility and customization.
Bottom Line
Grafana Labs defines modern observability.
This Grafana Labs review reveals a powerful, flexible observability platform. My comprehensive analysis shows its open-source foundation and extensive integration capabilities make it a strong contender for diverse data visualization needs, with caveats.
1. Overall Strengths
Grafana’s visualization power truly sets it apart.
Grafana’s highly customizable dashboards are its most celebrated feature, enabling beautiful and informative data presentation from myriad sources. It excels at integrating with a vast array of data sources, allowing you to centralize diverse metrics. From my comprehensive analysis, its ‘big tent’ data source integration is truly unmatched.
These strengths translate into superior data understanding and unified insights, crucial for driving informed business decisions and enhanced productivity.
- 🎯 Bonus Resource: While we’re discussing unified insights from diverse data, understanding cloud cost management software is equally important for financial optimization.
2. Key Limitations
Beware of the significant learning curve.
While simple dashboards are intuitive, mastering advanced features, query languages like PromQL, and the full LGTM stack presents a steep learning curve. Self-hosting also demands significant configuration and maintenance effort. Based on this review, the setup complexity can be daunting for many teams.
These limitations aren’t deal-breakers for dedicated teams but require a commitment to training and resource allocation for successful adoption.
3. Final Recommendation
Grafana Labs earns a solid recommendation.
You should choose Grafana Labs if your team values open-source flexibility, extensive data source integration, and powerful, custom visualization. It’s ideal for organizations ready to invest in learning complex query languages. From my analysis, it excels for data-driven, engineering-focused teams.
My recommendation is confident for teams prioritizing deep customizability, but less so for those seeking a turn-key SaaS solution.
Bottom Line
- Verdict: Recommended for engineering and data-driven teams prioritizing customizability
- Best For: Developers, SREs, and data analysts needing deep, flexible observability
- Biggest Strength: Unmatched data source integration and highly customizable dashboards
- Main Concern: Steep learning curve and self-hosted setup complexity
- Next Step: Explore the free tier or open-source Grafana to test capabilities
This Grafana Labs review demonstrates its immense value for organizations committed to building robust, custom observability solutions. My confidence in this assessment is high.