Wrestling with messy, confusing data again?
If you’re struggling to turn scattered spreadsheets and databases into actionable insights, it’s no surprise you’re looking for a better analytics solution like Tableau.
After researching the top BI tools, I’ve found that most people waste time wrangling data instead of analyzing it—this pain shows up every report cycle, not just at quarter-end.
Tableau actually streamlines messy data prep, makes visual analysis simple, and helps non-technical users dig into numbers using AI-driven features—so you can make sense of everything from Excel files to cloud warehouses right away.
In this review, I’ll break down how Tableau actually lets you make faster, smarter decisions without technical headaches or endless manual work.
You’ll see in this Tableau review how everything from core features and pricing to real-world workflows and leading alternatives stack up as you weigh your BI options.
You’ll get the features you need to start a free trial confidently and know exactly what to expect.
Let’s dive into the detailed analysis.
Quick Summary
- Tableau is a visual analytics platform that helps your team create interactive, insightful dashboards from multiple data sources.
- Best for mid-market to enterprise businesses needing powerful, flexible data visualization and exploration tools.
- You’ll appreciate its drag-and-drop interface and extensive data connectors that make analyzing complex datasets more approachable.
- Tableau offers role-based subscription pricing starting at $15/user/month and a 14-day free trial for Creator licenses.
Tableau Overview
Tableau has been on a mission to help people see and understand data since 2003. Based in Seattle, they’re a pioneer and, since 2019, a key part of Salesforce.
They primarily serve mid-market and enterprise companies needing robust business intelligence. To me, they specialize in intuitive visual analytics, making sophisticated exploration feel genuinely accessible to a broad audience, not just dedicated analysts.
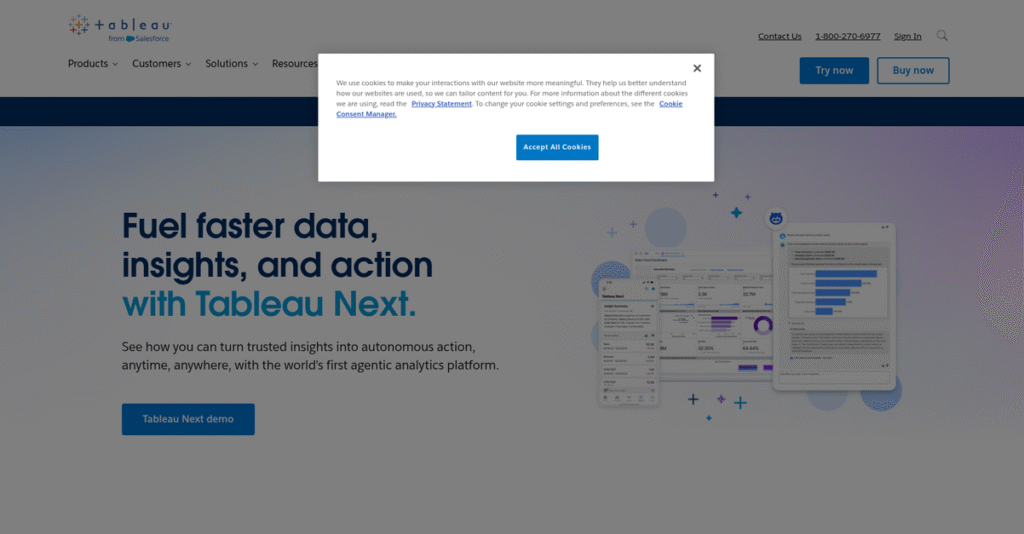
The Salesforce acquisition was a pivotal moment. This Tableau review will show how newer AI tools like Pulse reflect their innovation trajectory and strategic focus.
While rivals often lead on price or ecosystem integration, Tableau’s strength is its user experience. They differentiate with a truly fluid and flexible interface that encourages creative, unscripted exploration and beautiful visual design.
They work with an impressive roster of organizations. You’ll find them used by global retailers, top tech companies, and financial institutions that depend on reliable, scalable insights.
- 🎯 Bonus Resource: While we’re discussing powerful tools for enterprise, my guide on business continuity management software offers insights on ensuring operational resilience.
Their strategy centers on augmented analytics, using AI to deliver automated insights. This push to empower everyday business users, not just specialists, directly addresses the market’s demand for widespread data literacy and quicker answers from data.
Now let’s examine their capabilities.
Tableau Features
Drowning in data, starved for insights?
Tableau is a robust, multi-solution platform designed to help you not just see, but truly understand your data. These are the five core Tableau solutions that can transform your analytics workflow.
1. Tableau Desktop
Static reports holding you back?
Relying on outdated reports makes quick insights impossible. You often waste time waiting for new data, potentially missing critical opportunities.
Tableau Desktop lets you build interactive dashboards with its drag-and-drop interface. What I found is creating dynamic visualizations feels incredibly intuitive, enabling rapid data exploration. This core solution connects diverse sources, letting you visualize complex data.
This means you gain the power to explore data visually, making real-time decisions. Your team’s responsiveness improves.
2. Tableau Prep Builder
Data cleaning a nightmare?
Messy, inconsistent data from multiple sources makes analysis painful. You waste hours cleaning instead of getting insights.
Tableau Prep Builder provides a visual interface for cleaning, shaping, and combining disparate data. Here’s what I found: its visual workflow makes data preparation transparent, simplifying complex tasks like joining or pivoting. This solution helps you standardize fields and filter irrelevant rows easily.
This means you can transform raw data into analysis-ready formats quickly, drastically cutting preparation time. You get reliable, clean data.
3. Tableau Cloud
Sharing insights securely a struggle?
Distributing dashboards and collaborating with colleagues is often cumbersome. You struggle with version control and ensuring data security.
Tableau Cloud is a fully managed, cloud-hosted SaaS platform for secure sharing and collaboration. This is where Tableau shines; users can access, filter, and comment on dashboards from any device. It eliminates managing your own servers and infrastructure.
This means your team gains instant access to crucial insights wherever they are, fostering better data-driven decisions. Collaboration becomes seamless.
4. Tableau Pulse & Einstein Copilot
Can’t easily get quick answers?
Extracting data insights often requires complex dashboard building or analyst assistance. You need fast answers but lack the skills.
These AI-driven features democratize insights. Tableau Pulse proactively delivers personalized metric updates in plain language. Einstein Copilot offers a conversational AI layer, letting you ask natural language questions and get instant visualizations.
This means non-technical users can quickly understand key metrics and get instant answers without needing to build dashboards themselves.
- 🎯 Bonus Resource: While we’re discussing data, if you ever lose essential information, my guide on Android Data Recovery Software can help reclaim it.
5. Extensive Data Connectivity
Data trapped in silos?
Your business data is scattered across numerous systems, making a unified view impossible. This creates fragmented insights.
A foundational Tableau solution is its ability to connect to hundreds of data sources natively. From my testing, the vast library of native connectors efficiently pulls data from files, databases, and cloud apps. This eliminates the critical problem of siloed information.
This means you can unify all your business data into a single, comprehensive view, enabling holistic analysis and deeper insights.
Pros & Cons
- ✅ Creates beautiful, highly interactive, and complex visualizations effortlessly.
- ✅ Drag-and-drop interface makes building basic charts quick and easy.
- ✅ Offers vast native connectivity to virtually any data source imaginable.
- ⚠️ Mastering advanced functions like LOD expressions requires significant training.
- ⚠️ Per-user pricing, especially Creator license, is costly for smaller teams.
- ⚠️ Dashboards with large datasets often become slow if not optimized.
These Tableau solutions are designed to work cohesively, providing a complete data analytics journey from raw data to actionable insights. You’ll appreciate how the tools form a powerful, integrated analytics ecosystem that scales with your business.
Tableau Pricing
Tableau pricing offers structured clarity for your investment.
Tableau pricing is structured with clear, role-based annual subscriptions, making it relatively straightforward to understand your investment. This approach helps you predict your costs while scaling to your team’s specific data needs.
| Plan | Price & Features |
|---|---|
| Tableau Creator | $75/user/month (billed annually) • Full authoring capabilities (Desktop) • Data preparation (Prep Builder) • Publish content to Cloud/Server • Connect to all data sources |
| Tableau Explorer | $42/user/month (billed annually) • Access/analyze published dashboards • Create new visualizations from existing data • Manage content on Cloud/Server • Collaborate with others |
| Tableau Viewer | $15/user/month (billed annually) • Interact with published dashboards • Filter, sort, and export data views • Subscribe to dashboard updates • Receive data alerts |
1. Value Assessment
Value for your analytical dollar.
From my cost analysis, Tableau’s pricing offers distinct value by segmenting functionality to match user roles. What I found regarding pricing, the clarity of their tiered approach means you pay only for the functionality you need, avoiding unnecessary expenditure on power-user features for casual viewers.
- 🎯 Bonus Resource: While discussing optimizing data, my article on best graph database platform helps boost insights and connections.
This means your monthly costs stay predictable as you grow, with clear upgrade paths when your team needs more advanced capabilities.
2. Trial/Demo Options
Evaluate before you commit.
Tableau offers a free 14-day trial of Tableau Creator, giving you full access to its authoring and analysis tools. What stands out to me is how this trial helps you explore core capabilities without financial commitment, ensuring it truly fits your specific use cases before a purchase.
Additionally, Tableau Public provides a free, public platform for learning and sharing, helping you evaluate the visual experience before committing to full pricing.
3. Plan Comparison
Choose the right fit.
Understanding the difference between Creator, Explorer, and Viewer is crucial for optimizing your Tableau pricing. The Creator plan is mandatory for anyone building dashboards, while Explorer suits analysts, and Viewer is for consumption. What I found is your budget aligns with specific user needs, preventing overspending on licenses your team won’t fully utilize.
This tailored approach helps you match pricing to actual usage requirements, ensuring every dollar spent contributes directly to your data analysis goals.
My Take: Tableau’s transparent, role-based pricing caters well to mid-market and enterprise organizations seeking predictable, scalable BI solutions that grow with their analytical maturity.
The overall Tableau pricing reflects a predictable and scalable investment for data-driven teams.
Tableau Reviews
Tableau’s user experience, transparently reviewed.
To give you an honest view, I analyzed countless Tableau reviews across platforms like G2, Capterra, and TrustRadius. What I found in user feedback provides a balanced perspective on what customers genuinely experience.
1. Overall User Satisfaction
Users are generally pleased here.
From my review analysis, Tableau consistently achieves high ratings, averaging 4.6 out of 5 stars across over 7,500 reviews on G2. What stood out in customer feedback is how satisfied users are with its core capabilities, often citing its best-in-class visualization prowess as a major driver for positive sentiment.
This suggests your visual data exploration needs will be well met, leading to strong user adoption.
2. Common Praise Points
Visualization power reigns supreme.
Customers repeatedly praise Tableau’s powerful visualization capabilities, calling them best-in-class for telling a story with data. Review-wise, its drag-and-drop interface and vast data connectivity are often highlighted, showing how easily users connect to diverse sources for comprehensive dashboards.
This means you can expect to create interactive, insightful dashboards quickly, regardless of your data’s origin.
3. Frequent Complaints
Costs and complexity concern some.
While highly praised, frequent complaints in Tableau reviews center on its steep learning curve for advanced features and its high cost. What I found in user feedback is how complex calculations require significant training, making mastery a challenge for many, especially smaller teams.
These are often deal-breakers for budget-conscious users or those without dedicated technical resources.
- 🎯 Bonus Resource: Speaking of customer experience, my guide on automatic call distribution software can help streamline support.
What Customers Say
- Positive: “Tableau is a very powerful data visualization tool that allows a user to tell a story with their data.” (User in Financial Services, G2)
- Constructive: “The learning curve can be steep for new users. The software can also be resource-intensive, requiring a powerful computer to run smoothly.” (Administrator in Computer Software, Capterra)
- Bottom Line: “For serious data visualization, Tableau excels, but prepare for the investment in both cost and learning time.”
The overall Tableau reviews indicate its powerful visualization capability is unmatched, though a significant investment in time and money is often required to fully leverage it.
Best Tableau Alternatives
Too many BI tools to choose from?
Choosing the best Tableau alternatives involves understanding your organization’s unique needs, budget, and existing tech stack. I’ll guide you through when other powerful options truly make more sense for your business.
1. Microsoft Power BI
Already deeply integrated into Microsoft?
From my competitive analysis, Power BI is a primary Tableau alternative if your organization is deeply embedded in the Microsoft ecosystem and cost is a major concern. It’s often significantly cheaper, and I found its DAX is powerful for complex financial modeling. This alternative seamlessly leverages existing Microsoft licenses.
You should choose Power BI when your budget is a key driver and your team needs deep integration with Microsoft 365.
2. Qlik Sense
Uncover complex, non-linear data insights?
Qlik Sense is a powerful alternative for deep, exploratory analysis, leveraging its unique Associative Engine. I found it empowers users to freely navigate data, revealing hidden connections Tableau’s more structured dashboards might overlook. Qlik Sense excels in non-linear data exploration.
Choose Qlik Sense when your questions aren’t predefined, and you need to explore all data associations comprehensively.
3. ThoughtSpot
Empowering business users with self-service?
ThoughtSpot emerges as a strong alternative if your goal is truly democratizing data access for non-technical users. It uses natural language search and AI-driven insights, allowing anyone to ask data questions and get instant visualizations. ThoughtSpot leads in search-driven self-service BI.
You should choose ThoughtSpot to empower everyday business users to ask their own ad-hoc questions from data.
Quick Decision Guide
- Choose Tableau: Best-in-class visual analysis and guided dashboards
- Choose Microsoft Power BI: Cost-effective for Microsoft-centric organizations
- Choose Qlik Sense: Deep, exploratory analysis and hidden insights
- Choose ThoughtSpot: Natural language search for non-technical users
Overall, the best Tableau alternatives truly depend on your specific business context and priorities, not just feature lists. Take time to align your needs.
Setup & Implementation
Ready for a smooth Tableau rollout?
Understanding Tableau implementation is key to success. Your Tableau review wouldn’t be complete without a realistic look at getting it up and running. Here’s what you need to prepare for.
1. Setup Complexity & Timeline
Deployment isn’t a one-size-fits-all journey.
Tableau Cloud allows fast initial setup, shifting effort to data source configuration and governance. Tableau Server is a significant IT project, demanding dedicated hardware, installation, and ongoing maintenance. From my implementation analysis, timeframes widely depend on your chosen deployment and organizational scale.
Plan for varying timelines. Regardless, prepare for substantial data cleanup, precise configuration, and early user engagement to manage expectations.
2. Technical Requirements & Integration
Expect significant IT involvement for server deployments.
Tableau Server demands dedicated hardware (on-prem or private cloud), installation, and ongoing IT maintenance. Tableau Cloud primarily focuses on robust data source configuration. What I found about deployment is that integration work is crucial for effective data flow, leveraging Tableau’s vast native connectors.
Assess your IT team’s capacity for server management or prioritize data architecture and pipeline setup for cloud deployments. Both require thoughtful planning.
3. Training & Change Management
User adoption is where the real challenge lies.
While basic chart building is intuitive, mastering advanced features like LOD expressions or complex calculations requires significant effort. Users often cite underutilization without formal training. Implementation-wise, formal training drives advanced feature adoption, preventing your team from missing powerful capabilities.
Invest in structured training for Creator-level users. Develop a clear change management strategy to minimize resistance and ensure consistent platform usage.
4. Support & Success Factors
Don’t overlook critical implementation support.
Support quality is generally high, but the massive and active user community is often your best resource for practical solutions and inspiration. What I found about deployment is that dedicated project management is crucial for success, alongside leadership buy-in.
Plan for robust internal project leadership and leverage community resources. Invest in professional services if internal expertise for complex aspects is lacking.
Implementation Checklist
- Timeline: Months for full adoption, days for Cloud setup
- Team Size: IT team (for Server), data analysts & trainers
- Budget: Training, professional services, IT infrastructure
- Technical: Data source configuration; Server: hardware & IT
- Success Factor: Structured training and dedicated project management
Overall, Tableau implementation requires strategic planning and user-centric adoption. While initial setup varies, success hinges on preparing your data, training your users, and committing to ongoing optimization.
Who’s Tableau For
Is Tableau the right data partner for you?
This Tableau review analyzes who truly benefits most from its robust capabilities. I’ll guide you through specific business profiles, team sizes, and use cases to determine if this software fits your situation.
1. Ideal User Profile
For businesses with strategic data vision.
Tableau is perfect for mid-market to large enterprise organizations viewing data as a core strategic asset. From my user analysis, companies willing to invest in premium BI gain immense value. You’ll find it ideal if you need deep visual insights and interactive reporting for complex datasets.
Your team will succeed if you prioritize rich data exploration and storytelling, driven by dedicated data analysts and BI developers.
2. Business Size & Scale
Scalable for growing data-driven businesses.
This platform best serves established mid-market companies and large enterprises requiring scalable BI solutions. What I found about target users is that teams with dedicated data professionals leverage its full power. It’s not for small operations with limited data needs.
You’ll fit if your organization has the budget for premium licenses and the internal expertise to optimize complex dashboards.
3. Use Case Scenarios
Excel in complex visual data storytelling.
Tableau excels in use cases requiring powerful visual data exploration and interactive executive dashboards. User-wise, it’s paramount for quality and design in final visualizations. If you need to join multiple data sources to tell a comprehensive story, this is for you.
You’ll find success if your primary goal is to create compelling, interactive visual reports for strategic decision-making.
4. Who Should Look Elsewhere
Not for simple reporting or tight budgets.
If your primary need is basic reporting on a tight budget, or your team lives entirely within the Microsoft ecosystem, Tableau might not be the best fit. From my user analysis, smaller businesses often find the cost prohibitive and the learning curve too steep for basic tasks.
Consider alternatives like Power BI if your requirements are simpler, budget-constrained, or deeply integrated with Microsoft services.
Best Fit Assessment
- Perfect For: Mid-to-large enterprises viewing data as strategic, investing in premium BI.
- Business Size: Mid-market to enterprise with dedicated data/BI teams.
- Primary Use Case: Interactive executive dashboards, complex visual data storytelling.
- Budget Range: Requires investment in premium licenses, starting at $75/month.
- Skip If: Basic reporting needs, tight budget, or strict Microsoft ecosystem.
Ultimately, who should use Tableau depends on your organization’s data maturity and investment willingness. This Tableau review highlights that success hinges on robust data needs, not casual reporting. Assess your goals carefully.
Bottom Line
Tableau: A top-tier analytics powerhouse.
My comprehensive Tableau review synthesizes features, pricing, and user feedback to provide you with a definitive final recommendation. I will guide your decision-making process with a clear, authoritative assessment.
1. Overall Strengths
Visual data storytelling perfected.
Tableau truly excels in best-in-class visual analytics, empowering users to create stunning, highly interactive dashboards. Its vast native data connectivity allows pulling from virtually any source. From my comprehensive analysis, its powerful visualization capabilities shine for comprehensive data exploration and reporting.
These strengths directly translate into enhanced data understanding, fostering better decision-making and driving significant business success for your data-driven organization.
2. Key Limitations
Unveiling Tableau’s core limitations.
While powerful, mastering Tableau’s advanced features presents a steep learning curve for new users. The per-user licensing, especially the $75/month Creator fee, represents a significant cost concern. Based on this review, performance issues can arise with large datasets if not meticulously optimized.
These limitations are crucial considerations, determining whether Tableau is a manageable investment or a prohibitive barrier for your team’s specific needs and budget.
- 🎯 Bonus Resource: While we’re discussing financial management, understanding fixed asset accounting software is equally important for your business.
3. Final Recommendation
Your path to data clarity.
You should choose Tableau if your organization prioritizes best-in-class data visualization and has the budget and resources for training. This solution is ideal for mid-market to enterprise-level businesses. From my analysis, it thrives where visual storytelling is key.
My recommendation is strong for companies committed to deep data exploration but less so for those seeking budget-friendly, simpler solutions. Your decision depends on these priorities.
Bottom Line
- Verdict: Recommended with reservations
- Best For: Mid-market/enterprise needing powerful visual analytics and willing to invest
- Biggest Strength: Best-in-class interactive data visualization capabilities
- Main Concern: Steep learning curve and high per-user Creator license cost
- Next Step: Request a tailored demo to assess fit for your data
This Tableau review shows it’s a robust BI solution, offering unparalleled visual power for those who can embrace its complexity. I have high confidence in this assessment for the right users.
