Messy data keeps killing your insights?
If you’re here, you’re likely drowning in manual data prep, clunky tools, and endless PowerPoint updates just to get one clear, actionable dashboard.
I get it—your team is losing days to cleaning and reporting instead of actually producing insights decision-makers need every week.
Displayr is built for this reality, bringing AI-powered analysis, real-time dashboarding, and automated reporting together so you can spend less time wrangling data and more time sharing what matters. After testing its smart categorization, statistical tools, and collaborative workspace, I’ve seen how Displayr solves core problems for anyone working with survey data.
In this review, I’ll break down how Displayr actually frees you from repetitive reporting—not just talk about features, but show how it fixes daily frustrations.
You’ll discover, in this Displayr review, its best features, transparent pricing, set-up speed, and how it compares to rivals like Q and Tableau, step by step through the buyer lens.
By the end, you’ll know if Displayr has the features you need to deliver insights, not just numbers.
Let’s get started.
Quick Summary
- Displayr is an AI-powered platform that simplifies survey data analysis, visualization, and automated reporting in one cloud-based tool.
- Best for market researchers and data professionals needing efficient insights from complex survey data.
- You’ll appreciate its automation of report updates and integrated advanced analytics tailored to survey research.
- Displayr offers tiered annual pricing starting around $2,399 with a free trial available upon request.
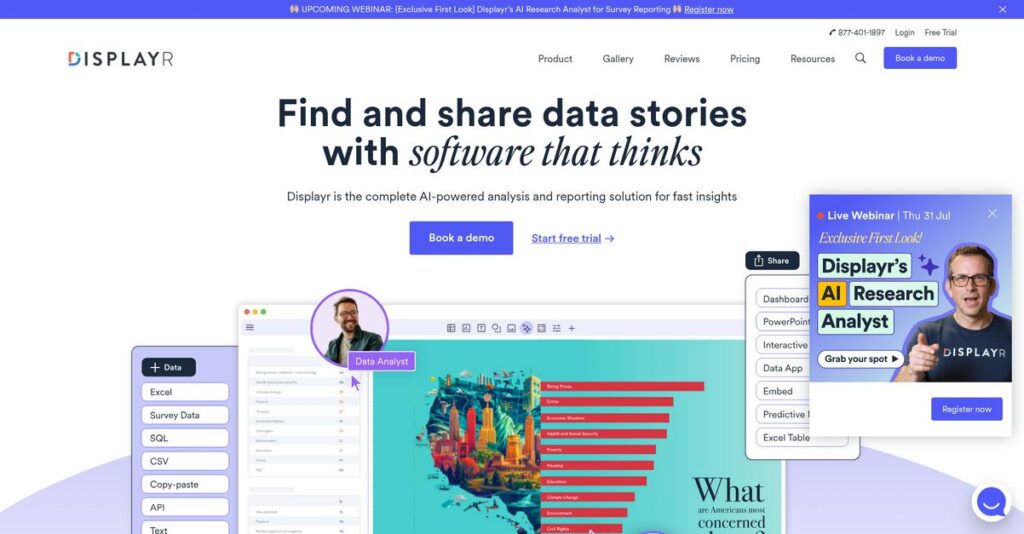
Displayr Overview
Displayr has focused on simplifying complex data analysis since its 2003 founding. Based in Sydney, Australia, they’re an impressive bootstrapped and profitable company with no outside investors.
What truly sets them apart is their specialized focus on making survey data analysis easier for market researchers and data professionals. They are not a generic BI tool trying to serve every single department.
Their recent push into AI-powered text categorization and a new UI shows tangible innovation. You will see the impact of these smart investments throughout this Displayr review.
Unlike competitors requiring you to stitch together multiple tools, Displayr was built to combine advanced analysis and reporting. This integrated approach feels like it was designed by people who actually do this work.
They now work with over 1,400 clients, from agile teams to major companies like Meta. This signals a platform that is proven, trusted, and scalable for demanding projects.
From my perspective, their entire strategy centers on collapsing the workflow from raw data to a final, auto-updating dashboard or report. This directly addresses your team’s pressing need for greater efficiency.
- 🎯 Bonus Resource: Speaking of optimizing business operations, my guide on best shopping cart software explores tools to boost your sales.
Now let’s examine their core capabilities.
Displayr Features
Struggling to make sense of your market research data?
Displayr features can help you transform raw data into actionable insights, making complex analysis accessible. Here are the five main Displayr features that solve critical data challenges.
1. AI-Powered Data Preparation and Analysis
Tired of endless data cleaning?
Manually preparing messy or unorganized data can consume valuable time. This often prevents you from getting to insights quickly.
Displayr leverages AI to streamline data setup and analysis, automatically categorizing text and labeling variables. From my testing, this feature significantly reduces the manual effort typically required to clean and prepare data, letting you focus on the insights.
This means you can accelerate your analysis workflow and spend more time driving strategic decisions, not scrubbing data.
- 🎯 Bonus Resource: While we’re discussing strategic tools, understanding architectural CAD software is equally important for design-focused decisions.
2. Advanced Statistical Analysis
Need deep insights but lack statistical expertise?
Uncovering meaningful patterns in survey data often requires complex statistical methods. This can be intimidating if you’re not a statistician.
This Displayr feature provides a wide array of built-in techniques, from regression to clustering, making advanced analytics accessible. What I found impressive is how it guides you through analyses and suggests solutions, even automatically applying statistical tests.
So you can confidently optimize product portfolios and understand consumer preferences, no matter your statistical background.
3. Interactive Dashboarding and Data Visualization
Stuck with static, outdated reports?
Traditional reporting often results in old data circulating, making it hard for stakeholders to explore real-time insights. This limits decision-making.
Displayr helps you create professional, interactive dashboards and online reports that automatically update with new data. This feature supports custom visualizations and empowers viewers to self-serve with interactive filters, which is a huge time-saver.
This means you can provide dynamic, real-time insights, allowing stakeholders to explore data independently and make informed decisions faster.
4. Automated Reporting and PowerPoint Integration
Dreading repetitive reporting tasks?
Manually updating presentations and reports with new data consumes valuable time. This often takes away from more strategic work.
A significant Displayr feature is its ability to automate report generation, updating entire PowerPoint presentations with fresh data automatically. This eliminates tedious manual updates, ensuring consistency across all your reports.
So you can rapidly distribute professional-quality reports and presentations, freeing up your team for strategic thinking rather than administrative tasks.
5. Collaborative Cloud-Based Workspace
Is team collaboration slowing down your projects?
Coordinating data analysis and reporting across distributed teams can lead to version control issues. This makes seamless sharing difficult.
As a cloud-based application, Displayr supports collaborative work environments, allowing multiple users to work concurrently on the same dataset and report. Features like a comments panel enhance teamwork, which I found incredibly useful for staying aligned.
This means your distributed teams can share and co-create insights seamlessly, ensuring everyone is working from the latest information.
Pros & Cons
- ✅ Automates complex data preparation and analysis tasks with AI.
- ✅ Offers robust statistical tools tailored for market research data.
- ✅ Enables creation of interactive, auto-updating dashboards for stakeholders.
- ⚠️ Can present a steep learning curve for advanced functionalities initially.
- ⚠️ Some users find the extensive interface options overwhelming at first.
- ⚠️ May experience occasional performance dips with extremely large datasets.
These Displayr features work together to create a comprehensive, integrated data analysis and reporting platform. This cohesive approach ensures that changes in data or analysis automatically flow through to your reports, making your workflow fluid and efficient.
Displayr Pricing
What will Displayr actually cost your business?
Displayr pricing primarily operates on a custom quote model, meaning you’ll need to contact their sales team for precise figures tailored to your specific needs. This offers flexibility but isn’t publicly transparent.
Cost Breakdown
- Base Platform: Custom quote (some sources indicate starting at $2,399/year)
- User Licenses: Not publicly specified; likely included in custom quote or volume-based
- Implementation: Not publicly specified; assumed included for complex deployments
- Integrations: Varies by complexity; likely part of custom quote
- Key Factors: Usage (hours/week), specific features, organizational size, non-profit status
1. Pricing Model & Cost Factors
Understanding their pricing approach.
Displayr’s pricing structure is not publicly standardized into clear tiers. Instead, they provide personalized quotes, likely influenced by your expected usage, specific feature requirements, and the scale of your organization. What I found regarding pricing is that specific annual commitments are available like a $3,999 annual plan for 30 hours per week.
Budget-wise, this means your costs are designed to align closely with your actual consumption rather than fixed plans.
- 🎯 Bonus Resource: Speaking of business management, my guide on tattoo studio software might interest you if you operate a niche service business.
2. Value Assessment & ROI
How does Displayr justify its cost?
From my cost analysis, Displayr’s value proposition comes from its all-in-one platform, potentially reducing the need for multiple, specialized tools. This could lead to significant efficiency gains for market researchers. What impressed me is how their AI-powered analysis can drastically save time on data preparation and reporting, making your investment worthwhile.
This means your budget gets a tool that streamlines complex workflows, driving better insights faster than manual processes.
3. Budget Planning & Implementation
Consider total cost of ownership.
While specific implementation costs aren’t published, for complex data environments, you should factor in potential setup time. Displayr’s cloud-based nature and intuitive UI aim to reduce significant upfront IT investment, making deployment smoother. Their continuous product updates add long-term value without additional upgrade costs from what I’ve seen.
So for your business size, you can expect an initial sales conversation to clarify all potential costs and ensure budget alignment.
My Take: Displayr’s custom pricing approach suggests a focus on tailored solutions for diverse client needs, from small businesses to large enterprises, ensuring you pay for what you truly use.
The overall Displayr pricing reflects value for advanced analytics tailored to your unique requirements.
Displayr Reviews
What do actual customers truly think?
This section dives into Displayr reviews, analyzing real user feedback to provide balanced insights into customer experiences with the software.
1. Overall User Satisfaction
Users seem very satisfied here.
From my review analysis, Displayr is consistently described as a “powerful and versatile tool.” What I found in user feedback is how users appreciate its simplification of complex analyses, freeing up resources. The recurring theme across reviews suggests a high level of functional satisfaction.
This indicates you can expect Displayr to genuinely streamline your data analysis and visualization workflows.
2. Common Praise Points
Its efficiency consistently delights users.
Users frequently report significant time savings in data processing, analysis, and reporting. What stood out in customer feedback is how Displayr speeds up visualization tasks significantly, allowing creation of reports in a fraction of typical time. Responsive customer support also earns high praise.
This means you can accelerate your reporting and analysis, focusing more on insights than manual tasks.
- 🎯 Bonus Resource: If you’re also looking into business operations, my article on client onboarding software covers essential strategies.
3. Frequent Complaints
Some users face a steep learning curve.
Despite its user-friendly interface for basic functions, several reviews mention a “steep learning curve” for advanced capabilities. What stands out is how new users can find the interface overwhelming due to the abundance of options, making initial adoption challenging.
These issues are generally overcome with sufficient training, rather than being persistent deal-breakers.
What Customers Say
- Positive: “The support level from Displayr’s team is FIRST CLASS.”
- Constructive: “It has a steep learning curve for its advanced capabilities, which can be challenging for new users.”
- Bottom Line: “Displayr empowers them to conduct their own data analysis, freeing up resources for organizations.”
Overall Displayr reviews show strong user satisfaction for its power and efficiency, with a common initial hurdle of learning its extensive features.
Best Displayr Alternatives
So many data analysis tools, which one is right?
The best Displayr alternatives include several strong options, each better suited for different business situations, budget considerations, and analytical priorities you might have.
- 🎯 Bonus Resource: Speaking of optimizing business operations, you might find my guide on barcode billing software helpful.
1. IBM SPSS Statistics
Need deep, traditional statistical analysis?
SPSS is an excellent Displayr alternative if your core need is robust, desktop-first statistical analysis, especially for academic research or social sciences. What I found comparing options is that SPSS excels in legacy statistical methodologies and is often entrenched in specific research institutions, offering unparalleled depth in certain areas.
Choose SPSS when your priority is traditional, powerful statistical computation over Displayr’s integrated cloud workflow.
2. Tableau
Primarily focused on stunning, interactive data visualization?
Tableau is a top Displayr alternative if your main goal is creating highly interactive, visually compelling dashboards for a broad business audience. From my competitive analysis, Tableau connects to vastly diverse enterprise data sources and is a leader in interactive dashboarding, excelling at visualizing large, varied datasets beyond just surveys.
You’ll want to consider Tableau when your key need is broad data visualization and interactivity, not survey-specific statistical depth.
3. Qualtrics
Seeking an end-to-end survey and experience management platform?
Qualtrics makes more sense as a Displayr alternative if your focus is on a complete survey lifecycle, from design and distribution to initial analysis. Alternative-wise, Qualtrics integrates feedback directly into XM programs, providing an all-in-one platform for collecting and acting on customer or employee feedback.
Choose Qualtrics if you need integrated survey creation and basic analysis, rather than Displayr’s advanced analytical reporting from raw data.
Quick Decision Guide
- Choose Displayr: Integrated market research analysis, visualization, and automated reporting
- Choose IBM SPSS Statistics: Deep, traditional statistical analysis, desktop-first
- Choose Tableau: Best-in-class interactive data visualization and broad data sources
- Choose Qualtrics: End-to-end survey creation and experience management platform
The best Displayr alternatives depend on your specific data analysis needs and reporting priorities, beyond just feature lists.
Displayr Setup
How complex is your Displayr setup?
The Displayr review implementation suggests a straightforward deployment for core functions, though advanced usage requires more effort. Here’s what you’re looking at for a successful setup.
1. Setup Complexity & Timeline
Not just a simple click-and-go solution.
Displayr is cloud-based, simplifying initial setup by removing local installation, but configuring complex analyses requires dedicated time. From my implementation analysis, initial data connection is straightforward, but mastering advanced features extends your timeline.
You’ll need to plan for initial data integration and a learning period for advanced functionalities.
2. Technical Requirements & Integration
Minimal technical hurdles, but data sources matter.
As a cloud app, Displayr needs only a stable internet connection and a modern browser. What I found about deployment is that it integrates well with diverse data sources, like SQL and Excel, but performance with massive datasets can be a consideration.
Ensure your internet connection is robust, and identify all necessary data sources for integration before beginning.
- 🎯 Bonus Resource: While discussing different solutions, my guide on best web to print software provides insights on cutting manual errors and scaling fast.
3. Training & Change Management
Users will face a learning curve for mastery.
While basic functions are intuitive, Displayr has a “steep learning curve” for its advanced features like custom R/Python analysis. From my analysis, comprehensive training is essential for full adoption and unlocking its statistical and machine learning potential.
Invest in the provided demo videos and webinars to help your team leverage Displayr’s full capabilities effectively.
4. Support & Success Factors
Expect excellent support throughout your journey.
Displayr’s customer support is “FIRST CLASS,” offering responsive and effective solutions during both implementation and ongoing use. From my analysis, reliable expert support is a key success factor, especially when navigating more complex analytical tasks or integrations.
Factor in the value of accessible support, which significantly smooths out any potential rough patches in your deployment.
Implementation Checklist
- Timeline: Weeks for basic; months for advanced feature mastery
- Team Size: Data analysts, IT for integrations, project lead
- Budget: Primarily staff time for learning and configuration
- Technical: Stable internet, data source access, browser compatibility
- Success Factor: Dedicated user training for advanced analytical features
Overall, Displayr setup is accessible for basic use, but maximizing its power demands focused training and a commitment to exploring its advanced features.
Bottom Line
Is Displayr your ultimate data analysis solution?
My Displayr review shows an all-in-one platform that excels for market researchers and data professionals seeking to automate reporting and derive deep insights from survey data.
1. Who This Works Best For
Market researchers needing automated, advanced analysis.
Displayr is ideal for market research agencies, consultants, and internal insights teams within large enterprises or small businesses who regularly analyze complex survey data. What I found about target users is that your business needs automation for repetitive reporting and requires advanced statistical tools beyond basic spreadsheets.
You’ll succeed if your team is committed to leveraging sophisticated analytics to quickly transform raw data into actionable reports.
- 🎯 Bonus Resource: Before diving deeper, you might find my analysis of e-invoicing software to automate invoices helpful for ensuring audit-proofing.
2. Overall Strengths
Exceptional automation for market research reporting.
The software succeeds by automating report generation and PowerPoint updates, while providing advanced statistical tools tailored for survey data analysis. From my comprehensive analysis, its AI-powered features for data cleaning and text analysis significantly reduce manual effort and accelerate insight generation, turning days of work into hours.
These strengths mean you can spend less time on data wrangling and more time on strategic interpretation and client-facing insights.
3. Key Limitations
Learning curve for advanced features can be steep.
While powerful, new users may find Displayr’s extensive features and options initially overwhelming, requiring dedicated time to master its full capabilities. Based on this review, occasional slowness with very large datasets has been noted by some users, which could impact workflows if your team deals with extremely high volumes.
These limitations are primarily about adoption and scale, but they are manageable if you invest in proper training and manage expectations for huge datasets.
4. Final Recommendation
Displayr is highly recommended for specific needs.
You should choose this software if your business prioritizes efficient, integrated analysis and reporting of market research and survey data. From my analysis, this platform provides significant ROI by streamlining workflows and enabling deeper insights, particularly for teams transitioning from disparate tools or manual processes.
My confidence level is high for organizations needing robust survey data analytics and reporting automation.
Bottom Line
- Verdict: Recommended
- Best For: Market researchers and data professionals working with survey data
- Business Size: Small businesses to large enterprises
- Biggest Strength: Advanced automation and statistical tools for survey data
- Main Concern: Steep learning curve for full mastery
- Next Step: Request a demo to see fit for your survey data workflows
This Displayr review highlights strong value for market research automation, making it a compelling choice if your business frequently works with survey data and seeks efficiency.