Are slow websites quietly costing you revenue?
If you’re here, your team is likely struggling to connect web performance issues with lost sales and customer frustration—especially when there’s pressure to prove the ROI of site improvements.
But let’s be real: You end up fighting invisible problems every single day that drain revenue and make every marketing dollar less effective.
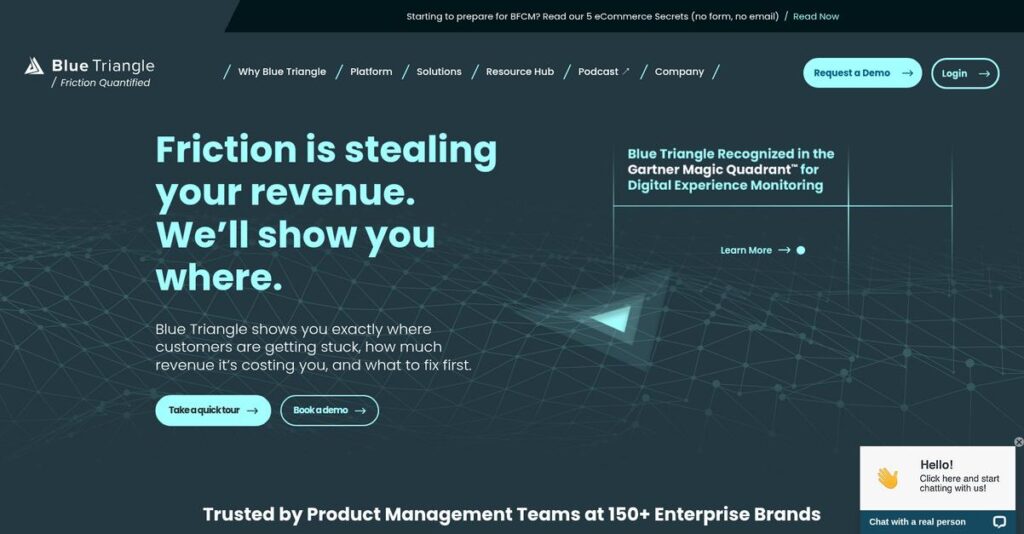
Blue Triangle is built for exactly this, offering a single dashboard where you can see, in plain numbers, how each performance and security fix translates into more sales, fewer user drop-offs, and real competitive gains.
So in this review, I’ll break down how Blue Triangle helps you tie website fixes to actual business impact—so you can finally justify your team’s priorities with clear data.
In this Blue Triangle review, I’ll cover their top features, pricing, demo experience, and how they stack up to other DEM tools, all from a hands-on evaluation perspective.
You’ll walk away knowing the features you need to make the right decision and the key details to help you compare solutions confidently.
Let’s get started.
Quick Summary
- Blue Triangle is a digital experience management platform that quantifies how website performance affects revenue and user friction.
- Best for mid-market and enterprise companies needing to link web performance to business outcomes.
- You’ll appreciate its real-time performance insights combined with strong tag governance and revenue impact quantification.
- Blue Triangle offers custom pricing tailored to enterprise needs, with demos available but no public trial information.
Blue Triangle Overview
Blue Triangle has been connecting digital experience to concrete business outcomes since they started back in 2011. From their Virginia headquarters, their entire mission is quantifying performance’s real financial impact.
They primarily serve enterprise retail, hospitality, and financial services where site speed directly translates to revenue. What I find truly sets them apart is their focus on quantifying revenue loss from user friction, a crucial specialization.
Their consistent recognition in Gartner’s Digital Experience Monitoring reports proves their ongoing market relevance. Through this Blue Triangle review, it’s clear this validates their unique, business-first approach to performance monitoring.
Unlike broad APM tools that can overwhelm you with IT data, Blue Triangle is built for business users. Their key advantage is translating performance metrics into financial terms, making it easier to justify optimization budgets.
- 🎯 Bonus Resource: While we’re discussing digital experience, understanding how to stop harmful blue light from screens is equally important.
You’ll find them working with major e-commerce brands, airlines, and banking institutions—any high-stakes environment where a minor website lag directly harms both the bottom line and customer trust.
From my analysis, their strategy centers on empowering marketing and e-commerce leaders with clear, actionable data. This directly addresses the market’s growing demand for shared digital experience ownership beyond the IT department.
Now let’s examine their core capabilities.
Blue Triangle Features
Website performance eating into your revenue?
Blue Triangle features provide a unified view of your digital experience, helping you quantify performance impact and optimize for business outcomes. Here are the five main Blue Triangle features that address critical digital experience challenges.
1. Real User Monitoring (RUM)
Ever wonder how slow page loads really hit your bottom line?
Understanding how customers experience your site in real-time is crucial, but it’s hard to link performance issues directly to lost revenue. This uncertainty makes prioritizing fixes a nightmare.
RUM captures resource-level data from real user browsers, showing you exactly how page load times affect conversion rates. From my testing, this feature makes it incredibly easy to identify where users face friction. You can connect technical performance directly to business metrics.
This means you can pinpoint issues with the biggest revenue impact and prioritize your optimization efforts effectively.
2. Synthetic Monitoring
Are you only finding out about site issues from your customers?
Waiting for customer complaints means you’re already losing business. Proactive testing is essential to catch problems before they impact user experience.
Blue Triangle’s synthetic monitoring proactively tests your site from various locations, ensuring uptime and performance. What I love about this is how it simulates complex user journeys like checkout processes, alerting you to issues before they go live. It catches problems before your customers do.
So, you can identify and fix performance bottlenecks in your testing environment, keeping your site consistently reliable for your visitors.
3. Tag Governance
Are third-party tags secretly slowing down your site?
Uncontrolled third-party tags can severely impact site performance and even pose security risks. Managing them effectively is a constant battle.
This feature visualizes and manages all your third-party tags in real-time, protecting your site from “offending” scripts. Here’s what I found: it gives you unprecedented control over external code, which is vital for both speed and security. You can identify and manage scripts that are dragging down performance.
This means you gain better control over your digital environment, improving site speed and bolstering your security posture against rogue tags.
4. Marketing Analytics
Struggling to connect marketing spend with site performance?
It’s tough to see how site speed or user experience truly affects your marketing campaign’s ROI. This makes optimizing ad spend feel like a guessing game.
Marketing Analytics connects web performance data with your marketing KPIs, showing how site speed impacts campaigns and revenue. This is where Blue Triangle shines, helping you see which paths convert best and where users struggle. You can see the direct impact of your site’s performance on your campaigns.
This allows you to optimize landing pages and user journeys, maximizing your marketing ROI and ensuring your ad spend isn’t wasted on slow experiences.
- 🎯 Bonus Resource: Speaking of optimizing for business outcomes, you might find my analysis of accelerate tax answers for your firm helpful.
5. Competitive Index
How do you stack up against your top competitors digitally?
Without clear competitive benchmarks, it’s hard to know if your digital experience is leading or lagging. This makes strategic planning a shot in the dark.
The Competitive Index lets you compare your site’s performance metrics like Page Load Time and Core Web Vitals against competitors. From my evaluation, this feature provides clear insights into where you need to improve to gain an edge. You can see exactly where competitors are outperforming you.
This means you can make data-driven decisions to enhance your digital experience, outpace rivals, and improve your search engine rankings.
Pros & Cons
- ✅ Excellent customer service and proactive support for complex issues.
- ✅ Quantifies revenue impact of performance, aiding ROI-driven decision making.
- ✅ Real-time RUM and synthetic monitoring provide deep, actionable insights.
- ⚠️ UI/UX can be tricky with some comparison charts being hard to read.
- ⚠️ Lacks analytical depth in session recordings or user behavior heat maps.
- ⚠️ Steeper learning curve for new users without thorough initial training.
These Blue Triangle features work together to create a holistic digital experience management platform that genuinely ties performance to profit.
Blue Triangle Pricing
What you’ll actually pay for Blue Triangle.
Blue Triangle pricing follows a custom quote model, which means you’ll need to contact sales but also get pricing tailored to your specific needs and operational scale.
Cost Breakdown
- Base Platform: Custom quote
- User Licenses: Varies by usage and features
- Implementation: Varies by complexity and integrations
- Integrations: Varies by complexity
- Key Factors: Data volume, features, user count, enterprise scale
1. Pricing Model & Cost Factors
Understanding Blue Triangle’s costs.
Blue Triangle’s pricing operates on a custom, enterprise-focused model, meaning no public tiers. What drives pricing are your specific requirements, including data volume, required features like RUM or Synthetic Monitoring, and the scale of your digital operations. From my cost analysis, this tailored approach ensures you only pay for what you truly need.
This means your monthly costs stay aligned with your business size and the breadth of digital experience management.
2. Value Assessment & ROI
Is the investment worthwhile?
Users consistently report Blue Triangle offers significant ROI by directly linking performance improvements to revenue gains. What I found regarding pricing is that it quantifies the financial impact of friction, helping you justify the cost by showing tangible business outcomes. This helps avoid you wondering about hidden costs.
The result is your budget gets better visibility, connecting digital experience spend directly to business results.
- 🎯 Bonus Resource: If you’re also optimizing your operations, my article on AI-driven supply chain optimization offers valuable insights.
3. Budget Planning & Implementation
Planning for total cost of ownership.
Given its enterprise focus, implementation will be a key cost factor beyond the subscription. From my research, expect professional services for setup, integration, and training to contribute significantly to your initial budget outlay. This ensures the platform is fully optimized for your specific environment and business goals.
So for your business, you can expect to allocate substantial budget upfront for a smooth, high-impact deployment process.
My Take: Blue Triangle’s custom pricing targets mid-market to enterprise businesses, providing a highly tailored solution that directly correlates digital experience improvements with quantifiable revenue impact.
The overall Blue Triangle pricing reflects premium enterprise value tailored to your digital goals.
Blue Triangle Reviews
What do real customers actually think?
Blue Triangle reviews consistently highlight its strength in performance insights, though some common usability points emerge from my analysis of user feedback.
1. Overall User Satisfaction
Users seem highly satisfied overall.
From my review analysis, Blue Triangle generally boasts impressive ratings, averaging 4.5 out of 5 stars on G2, with 85% of reviews being 5-star. What stands out is how users often praise its essential role in driving technical initiatives and ensuring good performance impact for online retailers.
This indicates you can expect a highly valued tool for digital experience management.
2. Common Praise Points
Exceptional customer service shines through.
Users frequently laud the outstanding customer service, noting the team’s responsiveness, helpfulness, and proactive approach with new ideas. From my review analysis, the ability to quantify revenue impact of performance is also consistently praised, making it easy to justify ROI.
This means you can expect strong support and clear financial justification for your optimization efforts.
- 🎯 Bonus Resource: While we’re discussing optimization efforts, understanding how to scale graph analytics for global apps is equally important.
3. Frequent Complaints
UI/UX aspects cause some frustration.
While powerful, some Blue Triangle reviews mention the UI can be “tricky to use” or that comparison charts are “hard to read.” What I found in user feedback is how the desire for more tool-tips and overviews within the UI is a common theme, especially for non-technical users.
These issues are generally minor and don’t seem to be deal-breakers for core functionality.
What Customers Say
- Positive: “The service and data captured is amazing, but the customer service provided by the Blue Triangle team is second to none.”
- Constructive: “The comparison charts are hard to read / present due to sorting based on change percentage instead of by actual time shift.”
- Bottom Line: “Definitely worth it for the cost involved! Easily make back the revenue due to smart targeting and ROI determination.”
The overall Blue Triangle reviews suggest a highly valuable tool with minor usability quirks that don’t detract from its core strengths.
Best Blue Triangle Alternatives
Considering other digital experience tools?
The best Blue Triangle alternatives include several strong options, each better suited for different business situations, priorities, and technical requirements.
1. Dynatrace
Need full-stack observability with AI-driven insights?
Dynatrace excels when your primary need is deep, full-stack APM with AI-driven insights across complex, dynamic multicloud environments. From my competitive analysis, Dynatrace offers more comprehensive application performance monitoring and extensive integrations than Blue Triangle’s specialized focus.
Choose Dynatrace if you require broad IT environment visibility, especially for complex, dynamic multicloud setups.
2. New Relic
Looking for unified observability for DevOps teams?
New Relic is a strong choice if you need a unified observability platform for engineering and DevOps teams to monitor and troubleshoot applications. What I found comparing options is that New Relic provides an all-in-one platform for telemetry data with a focus on code-level diagnostics, particularly in multi-cloud settings.
Consider this alternative when your focus is on a comprehensive, engineering-centric platform for multi-cloud application monitoring.
3. Catchpoint
Prioritizing proactive internet resilience monitoring?
Catchpoint is preferable for organizations that prioritize proactive monitoring of their internet-facing services and APIs from a vast global network of vantage points. Alternative-wise, Catchpoint excels in synthetic monitoring with global nodes to catch issues before they impact your business, a more specialized focus than Blue Triangle’s RUM.
Choose Catchpoint if proactive synthetic monitoring and external performance validation are your top priorities.
- 🎯 Bonus Resource: Speaking of monitoring web services, understanding compliant web analytics is crucial for data privacy.
4. Google Analytics
Working with budget constraints for basic web insights?
You would choose Google Analytics for general web analytics, understanding audience demographics, traffic acquisition, and basic on-site behavior. What I found comparing options is that Google Analytics provides comprehensive user behavior insights at no cost for its basic version, making it highly accessible compared to Blue Triangle.
Consider this alternative for foundational web analytics and audience insights, especially with budget limitations.
Quick Decision Guide
- Choose Blue Triangle: Quantifying revenue impact of web performance and tag governance
- Choose Dynatrace: Deep, AI-powered full-stack APM for complex IT environments
- Choose New Relic: Unified observability for multi-cloud DevOps and engineering teams
- Choose Catchpoint: Proactive synthetic monitoring from global vantage points
- Choose Google Analytics: Basic web analytics and audience insights on a budget
The best Blue Triangle alternatives depend on your specific business needs and budget priorities more than just feature lists.
Blue Triangle Setup
What are you signing up for?
This Blue Triangle review section breaks down what it takes to get up and running, focusing on real-world deployment and adoption. I’ll set realistic expectations for your implementation journey.
1. Setup Complexity & Timeline
Not entirely plug-and-play.
Blue Triangle implementation involves integrating monitoring scripts into your website and configuring its powerful tag management platform. What I found about deployment is that initial adoption for non-technical users has a steep learning curve, impacting your overall timeline if training isn’t prioritized.
You’ll need to plan for script deployment and allow time for your team to grasp the platform’s full capabilities.
- 🎯 Bonus Resource: If you’re also looking into maximizing platform capabilities, my article on powerful video marketing analytics covers more.
2. Technical Requirements & Integration
Expect some IT team involvement.
Your technical team will handle integrating Blue Triangle’s SaaS platform with your website to capture real user data and set up synthetic monitoring. From my implementation analysis, the platform scales to high-demand enterprises, meaning your IT setup should accommodate robust data capture.
Prepare your IT infrastructure to support ongoing data validation and regular website code checks.
3. Training & Change Management
User adoption is key for full value.
Given the depth of data and insights, training is crucial for your team to leverage Blue Triangle effectively, especially for correlating performance to business metrics. From my analysis, understanding data nuances requires guided learning to move beyond basic dashboards and fully utilize the analytics.
Invest in thorough training for all users to ensure they can confidently navigate the UI and interpret complex data.
4. Support & Success Factors
Exceptional support simplifies deployment.
Blue Triangle consistently receives high praise for its “exceptional” and “responsive” customer support, which significantly eases both implementation challenges and ongoing usage. What I found about deployment is that proactive support is a critical success factor, helping you troubleshoot and optimize effectively.
Partner closely with their support team, as their guidance can accelerate your learning and maximize platform value.
Implementation Checklist
- Timeline: Weeks to months depending on integration complexity
- Team Size: Web development, IT, and analytics team members
- Budget: Training resources and potential professional services
- Technical: Website script integration and synthetic monitoring setup
- Success Factor: Comprehensive user training and strong vendor support
The overall Blue Triangle setup requires focused effort on training and integration, but its powerful insights are invaluable for optimizing digital experiences.
Bottom Line
Is Blue Triangle the right choice for your business?
My Blue Triangle review provides a comprehensive analysis of its capabilities, helping you determine if this digital experience management platform aligns with your specific operational needs.
1. Who This Works Best For
Revenue-driven mid-market and enterprise companies.
Blue Triangle is ideal for organizations heavily relying on their digital presence, especially in e-commerce, retail, and financial services, where online experience directly impacts revenue. From my user analysis, businesses focused on quantifying performance impact will find its financial correlation invaluable for strategic prioritization and maximizing ROI.
You’ll succeed if your primary goal is to directly link website performance and user experience to clear, quantifiable revenue outcomes.
2. Overall Strengths
Quantifying revenue impact is its greatest strength.
The software excels by directly connecting website performance and user experience issues to quantifiable revenue losses, enabling businesses to prioritize fixes with the highest ROI. From my comprehensive analysis, its ability to financialize performance friction sets it apart, providing clear business justification for technical investments.
These strengths translate into a powerful competitive advantage by allowing your teams to focus resources on initiatives that directly improve your bottom line.
- 🎯 Bonus Resource: Before diving deeper, you might find my analysis of predictive analytics for site data helpful to further optimize your strategy.
3. Key Limitations
Learning curve and UI/UX aspects need attention.
While powerful, new users may experience a steep learning curve, and some aspects of the user interface could be more intuitive and modern. Based on this review, the lack of deep analytical features like session recordings limits comprehensive user behavior insights for some teams, requiring additional tools.
I consider these limitations manageable trade-offs for its core strengths, but they warrant consideration for teams seeking an all-in-one analytical solution.
4. Final Recommendation
Blue Triangle comes highly recommended for specific needs.
You should choose Blue Triangle if your business prioritizes understanding and optimizing the direct financial impact of your digital experience, particularly in revenue-generating industries. From my analysis, this solution shines for strategic performance and revenue optimization over general web analytics or full-stack APM.
My confidence level is high for mid-market and enterprise companies prioritizing digital experience ROI and seeking exceptional support.
Bottom Line
- Verdict: Recommended for revenue-focused digital experience optimization
- Best For: Mid-market and enterprise e-commerce, retail, and financial services
- Business Size: Companies with high digital revenue reliance and performance demands
- Biggest Strength: Quantifying financial impact of website performance and user friction
- Main Concern: Initial learning curve and some UI/UX areas for improvement
- Next Step: Request a demo to see its revenue quantification features in action
This Blue Triangle review shows strong value for the right business profile, offering a unique focus on revenue-driven digital experience optimization.


