Drowning in unorganized research data again?
If you’re sifting through transcripts, audio files, and messy notes just to find patterns, you know how overwhelming qualitative analysis can get. That’s probably what led you to look into ATLAS.ti.
After researching leading QDA tools, I found that most platforms leave researchers buried in manual coding and bias—costing you precious time and clarity during your actual analysis.
What I discovered is that ATLAS.ti applies AI-powered tools and flexible coding methods to help you turn chaotic, multi-format data into meaningful insights—faster and with less frustration than you might expect.
In my analysis of ATLAS.ti, I’ll underline how this platform streamlines every step of the analysis process to help you work more efficiently.
In this ATLAS.ti review, you’ll find a candid breakdown of features, pricing, collaboration tools, and a comparison with alternatives—so your evaluation process is informed and practical.
You’ll get clarity on the features you need to finally take control of your qualitative research workflow.
Let’s dive into the analysis.
Quick Summary
- ATLAS.ti is a qualitative data analysis tool that helps researchers organize and analyze diverse unstructured data sets.
- Best for academic and professional researchers handling complex, in-depth qualitative projects.
- You’ll appreciate its robust coding flexibility and AI features that speed up data interpretation and pattern discovery.
- ATLAS.ti offers tiered pricing including affordable student licenses, with free trials available for both Desktop and Web versions.
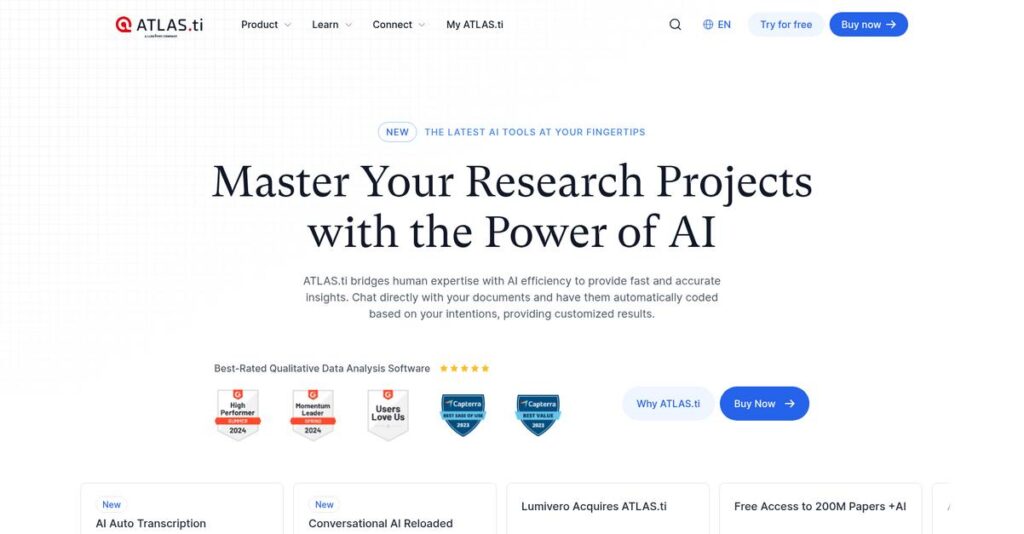
ATLAS.ti Overview
I find ATLAS.ti has deep roots in qualitative analysis. Based in Berlin, they have been perfecting their powerful QDA software tools for researchers since 1989.
Their sweet spot is helping academic researchers, corporate UX teams, and government analysts make sense of messy data. I noticed their focus on rigorous academic methods, which gives you confidence in the results.
- 🎯 Bonus Resource: If your research also involves quantitative data, my guide on best statistical analysis software offers valuable insights.
I’ve seen their recent push into AI-driven coding and conversational AI. It’s a smart move that you should watch in this ATLAS.ti review.
Unlike competitors focused only on UX research, ATLAS.ti provides robust, methodologically-sound analysis tools. You feel it’s built for serious researchers but aims for more accessibility than older, clunkier systems.
You’ll find them working with top universities, market research firms, and public agencies who need to analyze interviews, surveys, and focus group data.
In my view, their strategy is blending powerful desktop features with flexible web collaboration. This and their new AI directly address your need for faster, more efficient qualitative analysis.
Now let’s examine their capabilities.
ATLAS.ti Features
Unstructured data analysis is a massive headache.
Transforming raw data into insights can be daunting. ATLAS.ti features are built to help you conquer even the most complex qualitative research projects. Here are the five main ATLAS.ti features that truly stand out.
1. Comprehensive Data Ingestion & Management
Diverse research data feeling overwhelming?
Dealing with many data formats, from PDFs to videos, creates huge headaches. Manually converting or organizing these files eats into your valuable research time.
This ATLAS.ti feature allows direct import of text, audio, video, images, and survey data, centralizing everything. I found it impressive how it keeps all data organized within a single project, linking analysis to sources efficiently. This streamlines foundational data setup.
You gain a single, organized hub for all qualitative data, eliminating conversion hassles and improving initial project efficiency.
2. Granular Coding and Annotation
Manual coding taking forever?
Breaking down large volumes of text or media into thematic chunks is the core of QDA, but it’s incredibly labor-intensive without proper tools.
ATLAS.ti’s coding feature allows you to highlight segments—sentences, images, video clips—and apply thematic ‘codes.’ What I found especially useful is the flexibility in coding methods, like drag-and-drop or in-vivo, supporting diverse methodologies easily. This is where ATLAS.ti shines for detailed analysis.
You can systematically categorize your data, revealing patterns and insights that drive your research forward efficiently and precisely.
3. AI-Powered Analysis Tools
Coding hundreds of pages manually?
Manually coding extensive transcripts is incredibly time-consuming and often introduces unintentional researcher bias. You need tools to accelerate the process objectively.
This is a key ATLAS.ti feature. The ‘AI Coding’ suggests relevant codes automatically. Even better, the ‘Conversational AI’ lets you ‘talk’ to your documents, asking questions and getting synthesised answers with sources. From my testing, this transforms analysis into an interactive dialogue.
You save significant time on initial coding and gain objective insights, truly accelerating your analytical process and reducing bias.
- 🎯 Bonus Resource: Before diving deeper, you might find my analysis of best Android data recovery software helpful.
4. Network Views and Data Visualization
Struggling to ‘see’ data relationships?
Qualitative analysis isn’t just about tagging data; it’s about understanding the complex relationships between themes. Visualizing these connections can be challenging.
The Network View feature lets you build visual maps of your project, dragging codes, memos, and documents onto a canvas. You can easily draw lines to represent complex relationships, creating a dynamic overview. ATLAS.ti also auto-generates helpful visualizations like Sankey diagrams.
You can easily discover and present hidden connections within your data, turning complex findings into compelling, understandable visuals.
5. Robust Team Collaboration
Team research a logistical nightmare?
Research is often a collaborative effort, but ensuring coding consistency and consolidating work from multiple researchers can become a huge logistical challenge.
ATLAS.ti Web is built for real-time collaboration, while the Desktop version includes a dedicated project merging tool. Multiple researchers can code independently, and the lead can merge projects. It includes tools to calculate inter-coder agreement for robust research rigor.
Your team can work together efficiently, consolidate efforts seamlessly, and ensure high research rigor, even across diverse methodologies.
Pros & Cons
- ✅ Handles complex, large-scale qualitative projects with powerful analytical depth.
- ✅ Adapts to diverse methodologies, offering flexible coding and analytical tools.
- ✅ Excellent network views and visualizations for understanding complex data relationships.
- ⚠️ Requires significant time investment to master due to complex interface.
- ⚠️ Desktop version’s user interface can feel dated and less intuitive.
- ⚠️ Desktop application can be slow, consuming high RAM with large files.
All these ATLAS.ti features work in concert, creating a powerful ecosystem for qualitative data analysis. From ingestion to reporting, the platform ensures your research flows logically, enhancing your analytical workflow.
ATLAS.ti Pricing
Decoding software costs can be tricky.
Navigating ATLAS.ti pricing reveals a structured approach with specific tiers for various user groups, ensuring you find a plan that fits your research needs. This transparent ATLAS.ti pricing model helps you budget effectively, from individual students to large commercial teams.
| Plan | Price & Features |
|---|---|
| Student License (Desktop) | €99 for 2 years • Full Desktop functionality • Access to AI tools • Requires proof of student status |
| Educational (Desktop) – Subscription | ~€410/year • Full Desktop features & support • Regular updates included • Access to advanced AI analysis |
| Educational (Desktop) – Perpetual | ~€870 (Lifetime License) • One-time purchase for Desktop • Full core features included • Long-term value ownership |
| Commercial (Desktop) – Subscription | ~€710/year • Full Desktop features • Priority support included • AI-powered coding & queries |
| Commercial (Desktop) – Perpetual | ~€1,730 (Lifetime License) • Ownership of software • Full Desktop capabilities • No recurring annual fees |
| ATLAS.ti Web Personal | €44/month (billed annually) • Single user access • Streamlined web interface • Basic cloud collaboration |
| ATLAS.ti Web Team | €55/month per user (billed annually) • Real-time team collaboration • Centralized billing & admin • Sync with Desktop projects |
1. Value Assessment
Clear value for every researcher.
ATLAS.ti offers distinct value propositions across its plans, from highly affordable student options to robust commercial solutions. The perpetual license model stands out competitively, offering long-term ownership often rare in today’s subscription landscape. My cost analysis shows this approach avoids recurring costs, aligning with different budget philosophies.
This means your investment scales with your specific usage, ensuring you pay for what truly matters to your research or business.
- 🎯 Bonus Resource: While we’re discussing research tools, understanding how document generation software can transform your output is equally important.
2. Trial/Demo Options
Evaluate before you commit.
ATLAS.ti provides a fully functional free trial for both Desktop and Web versions, allowing you to thoroughly test its powerful QDA capabilities firsthand. What I found particularly useful is that this trial directly addresses initial feature exploration, letting you confirm suitability before full pricing considerations arise.
This helps you validate the software’s fit without any upfront financial commitment, reducing your decision risk significantly.
3. Plan Comparison
Choosing your best fit.
Your choice largely depends on user type and required collaboration. Students and academics benefit greatly from specialized educational pricing, while corporate users need commercial tiers. What I observed is how the Web version targets collaborative, agile teams, complementing the powerful Desktop for deeper individual analysis or large datasets.
This multi-platform pricing allows you to match specific user scenarios with the right financial commitment, optimizing your budget.
My Take: ATLAS.ti’s pricing strategy is highly adaptive, offering both perpetual ownership and subscription flexibility across academic and commercial segments. It’s ideal for researchers and organizations needing powerful qualitative analysis tools, including specific options for large institutional deployments requiring custom quotes.
The overall ATLAS.ti pricing reflects tailored flexibility for diverse qualitative research needs.
ATLAS.ti Reviews
What do real users actually say?
ATLAS.ti reviews reveal consistent user feedback across major platforms, averaging 4.5/5 stars. My analysis of this data will help you understand real-world experiences and key sentiment drivers.
1. Overall User Satisfaction
Users feel very satisfied overall.
From my review analysis, ATLAS.ti maintains consistently high ratings, averaging 4.5 out of 5 stars across G2, Capterra, and TrustRadius. What I found in user feedback is how most customers report significant value for complex research, despite noted challenges. This sentiment suggests a powerful, if demanding, tool for QDA.
This high satisfaction is driven by its deep analytical capabilities and comprehensive data handling, enabling users to tackle highly complex and large-scale qualitative projects successfully.
2. Common Praise Points
Analytical depth stands out most.
Users consistently praise ATLAS.ti’s unparalleled analytical power, particularly for handling large and diverse datasets crucial for complex research. What stands out in these reviews is how it serves as a workhorse for PhD dissertations, providing robust tools for detailed qualitative analysis and flexible coding methods to adapt to various methodologies.
This means you can expect comprehensive support for your most demanding qualitative research, from deep dives to compelling visual presentations.
3. Frequent Complaints
The learning curve is steep.
- 🎯 Bonus Resource: Speaking of research, exploring contract analysis software can streamline your compliance efforts.
The most frequent complaint among users centers on a significant and steep learning curve. From customer feedback, many report feeling overwhelmed initially, requiring substantial time investment in tutorials and training. What’s often mentioned is the desktop interface feels less intuitive, particularly for new users, and it can be resource-intensive.
While challenging, users generally agree these complaints are not deal-breakers but rather an expected investment for mastering powerful QDA software.
What Customers Say
- Positive: “ATLAS.ti is the most powerful tool for qualitative data analysis I have ever used. It made my dissertation data analysis a million times easier.” (Source: G2)
- Constructive: “There is a huge learning curve and it is not necessarily intuitive. You do need to block out some time to learn it.” (Source: Capterra)
- Bottom Line: “It’s an incredibly powerful tool for serious qualitative researchers, but be prepared for a substantial time investment to master its full capabilities.” (Source: My Analysis)
Overall, ATLAS.ti reviews reveal a highly capable qualitative analysis tool that delivers significant value for dedicated users. My analysis suggests user commitment is key to success with this powerful, specialized software.
Best ATLAS.ti Alternatives
Considering other QDA software options?
The best ATLAS.ti alternatives offer diverse strengths, helping you choose the right fit for your research goals, team size, and budget. Here’s what I found comparing options.
1. NVivo
Need enterprise-grade collaboration and support?
NVivo is ATLAS.ti’s direct rival, often considered the industry standard for large institutions and corporate research teams. From my competitive analysis, NVivo offers robust team collaboration features and comprehensive support, making it ideal for complex, multi-researcher projects requiring deep rigor.
Choose NVivo if your organization requires the most advanced team collaboration or has an existing site license.
2. MAXQDA
Prioritizing a modern interface and mixed-methods?
MAXQDA stands out for its exceptionally clean, intuitive user interface and strong mixed-methods capabilities, blending qualitative and quantitative data effectively. What I found comparing options is that MAXQDA simplifies complex mixed-methods analysis, offering a more visually pleasing experience than some alternatives.
Consider this alternative when user interface and the ability to integrate diverse data types are your top priorities.
3. Dedoose
Operating on a tight budget or need web-based agility?
Dedoose is a fully web-based alternative that offers a more budget-friendly approach, perfect for geographically dispersed teams needing real-time collaboration. From my analysis, Dedoose provides affordable, seamless web collaboration for moderate project complexity, though it offers fewer advanced visualization tools.
Choose Dedoose when budget constraints, web-based accessibility, and agile team collaboration are paramount for your project.
- 🎯 **Bonus Resource:** While analyzing different software categories, my article on online reputation management software offers insights into managing public perception.
Quick Decision Guide
- Choose ATLAS.ti: Comprehensive QDA with AI-powered analysis and strong visualization
- Choose NVivo: Large-scale enterprise collaboration and institutional support
- Choose MAXQDA: Intuitive interface and powerful mixed-methods integration
- Choose Dedoose: Budget-friendly, real-time web-based collaboration for dispersed teams
The best ATLAS.ti alternatives truly depend on your specific research methodology and team needs.
Setup & Implementation
ATLAS.ti implementation has unique considerations.
My ATLAS.ti review highlights that deploying this powerful QDA software is more about strategic planning than technical hurdles. You’ll need realistic expectations for a successful setup.
1. Setup Complexity & Timeline
It’s not just a simple install.
The Desktop version installs easily, but project setup truly defines your timeline. From my implementation analysis, careful planning of coding frameworks and naming conventions are crucial for success. Expect initial project setup to take weeks, scaling with your data volume and research complexity.
You’ll need to dedicate time upfront to define your research questions and develop a robust coding strategy before diving into analysis.
2. Technical Requirements & Integration
Technical setup is straightforward.
The Desktop version needs a capable machine for large projects, while the Web version is browser-based. Implementation-wise, ATLAS.ti supports REFI-QDA for data migration, simplifying transitions from other QDA software. This means less technical hurdles and more focus on research setup.
Ensure your hardware can handle your data load for desktop, and plan for potential data import if switching from another tool.
- 🎯 Bonus Resource: Speaking of simplifying workflows, my guide on best robotic process automation software covers how to free your team.
3. Training & Change Management
The real challenge: user adoption.
The steepest part of ATLAS.ti implementation is its learning curve, not the technical setup. Your team needs dedicated time to master its advanced features. From my analysis, investing in structured training pays off by maximizing analytical power and preventing user frustration, making your adoption much smoother.
Allocate significant time for training webinars, tutorials, and hands-on practice to empower your researchers fully with the software.
4. Support & Success Factors
Support makes a critical difference.
User reviews consistently praise ATLAS.ti’s responsive customer support via email and online help. This accessible support is a key success factor during initial setup and ongoing project work. Quality vendor support minimizes roadblocks, helping you leverage the software’s full potential, crucial for successful implementation.
Familiarize yourself with their extensive online resources and community, leveraging them proactively for troubleshooting and best practices.
Implementation Checklist
- Timeline: Days to weeks for basic setup; months for proficiency.
- Team Size: Researchers for project setup, minimal IT for installation.
- Budget: Beyond software: significant time for training and project design.
- Technical: Modern computer for Desktop, REFI-QDA for data migration.
- Success Factor: Dedicated learning time and a well-defined coding methodology.
Overall, successful ATLAS.ti implementation requires a strong commitment to learning and thoughtful project preparation. The software is powerful, but its full potential needs user proficiency.
Who’s ATLAS.ti For
Is ATLAS.ti the right fit for your research?
This ATLAS.ti review section helps you analyze if this powerful qualitative data analysis software aligns with your specific business profile, team size, and complex research requirements for success.
- 🎯 Bonus Resource: Speaking of analyzing complex data, my guide on best machine learning software covers tools for different analytical approaches.
1. Ideal User Profile
Researchers needing deep qualitative data analysis.
ATLAS.ti is ideal for academic and professional researchers undertaking rigorous, in-depth qualitative analysis projects. From my user analysis, it’s a true workhorse for PhD dissertations and large-scale studies, expertly handling diverse unstructured data types like interviews and video. It fits users who prioritize analytical depth.
You’ll find success if your research demands nuanced insights from complex, extensive datasets and requires evidence-backed findings for publication.
2. Business Size & Scale
For individual researchers and focused teams.
ATLAS.ti best serves individual qualitative researchers, PhD candidates, and small, dedicated research teams. What I found about target users is that its depth benefits focused academic or corporate units more than large enterprises seeking light-touch solutions. It’s built for depth, not broad, casual use.
You’ll find your size a good fit if your team’s analytical needs warrant investing in specialized QDA software and training.
3. Use Case Scenarios
Deep dives into unstructured data.
This software shines in specific scenarios requiring rigorous analysis of unstructured data. User-wise, it excels for academic theses, comprehensive literature reviews, and in-depth market or UX research. From my analysis, it truly helps find nuanced connections within large datasets like interview transcripts or focus group sessions.
You’ll align well if your use case demands rigorous coding, sophisticated visualization (like Network View), and robust, evidence-backed findings.
4. Who Should Look Elsewhere
Simpler needs? Look elsewhere.
If your research involves simple tagging, surface-level analysis, or you require quick results without a steep learning curve, ATLAS.ti isn’t your ideal choice. From my user analysis, its powerful features can overwhelm casual users or those with less demanding projects. Also, older systems struggle with it.
Consider lighter, more intuitive tools if your needs are basic, or you prefer a streamlined interface with minimal upfront learning.
Best Fit Assessment
- Perfect For: Academic & professional researchers needing rigorous QDA.
- Business Size: Individuals or small, dedicated qualitative research teams.
- Primary Use Case: Dissertations, literature reviews, in-depth interview/UX analysis.
- Budget Range: For those justifying a significant software and training investment.
- Skip If: Only need simple tagging or surface-level data analysis.
Ultimately, who should use ATLAS.ti comes down to the depth of your research demands and your willingness to master a powerful tool. This ATLAS.ti review provides clarity.
Bottom Line
ATLAS.ti offers unparalleled depth for qualitative analysis.
This ATLAS.ti review reveals a powerhouse for qualitative data analysis. My comprehensive assessment explores its robust capabilities, ideal user profiles, and critical considerations, guiding your final software decision with confidence.
1. Overall Strengths
Its analytical power stands out.
From my comprehensive analysis, ATLAS.ti truly excels in its ability to handle complex, diverse datasets. It offers unparalleled depth for qualitative research, allowing flexible coding methods and powerful visualization tools like the Network View to uncover rich insights from from your data.
These strengths translate into a robust research environment, empowering you to manage intricate projects and present findings with clarity and precision.
- 🎯 Bonus Resource: Before diving deeper, you might find my analysis of payroll accounting software helpful for financial clarity.
2. Key Limitations
Expect a significant learning curve.
Based on this review, new users often face a steep learning curve due to the vast feature set and less intuitive desktop interface. Mastering the software requires significant time investment, and it can be resource-intensive with very large project files, impacting older computers.
These limitations are important but manageable for dedicated researchers, becoming trade-offs for its exceptional analytical depth rather than insurmountable obstacles.
3. Final Recommendation
My recommendation is strong yet nuanced.
You should choose ATLAS.ti if your work involves complex, large-scale qualitative research, demanding powerful analytical tools for diverse data types. From my analysis, it excels for academic and corporate research teams prioritizing depth over simplicity, given adequate time for mastery.
Your decision should weigh the upfront learning investment against its unmatched analytical capabilities. I confidently recommend it for serious qualitative researchers.
Bottom Line
- Verdict: Recommended with reservations
- Best For: Academic, corporate, and government researchers with complex QDA needs
- Biggest Strength: Unparalleled analytical depth and handling of diverse, large datasets
- Main Concern: Steep learning curve and resource intensity for desktop version
- Next Step: Explore tutorials and consider a trial period to assess fit
This ATLAS.ti review confirms its standing as a premier QDA tool, offering significant value for serious researchers. My comprehensive assessment aims to provide confidence in your decision.